Screen Shots

  • 3D Visualization of Busway Infrastructure
    3D Visualization of Busway Infrastructure
    3D Visualization of Busway Infrastructure

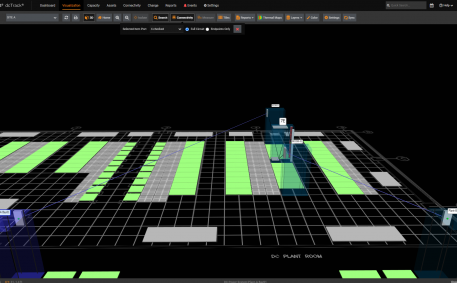
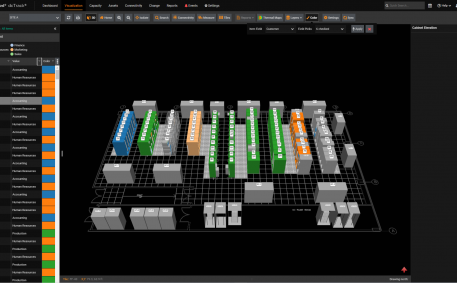
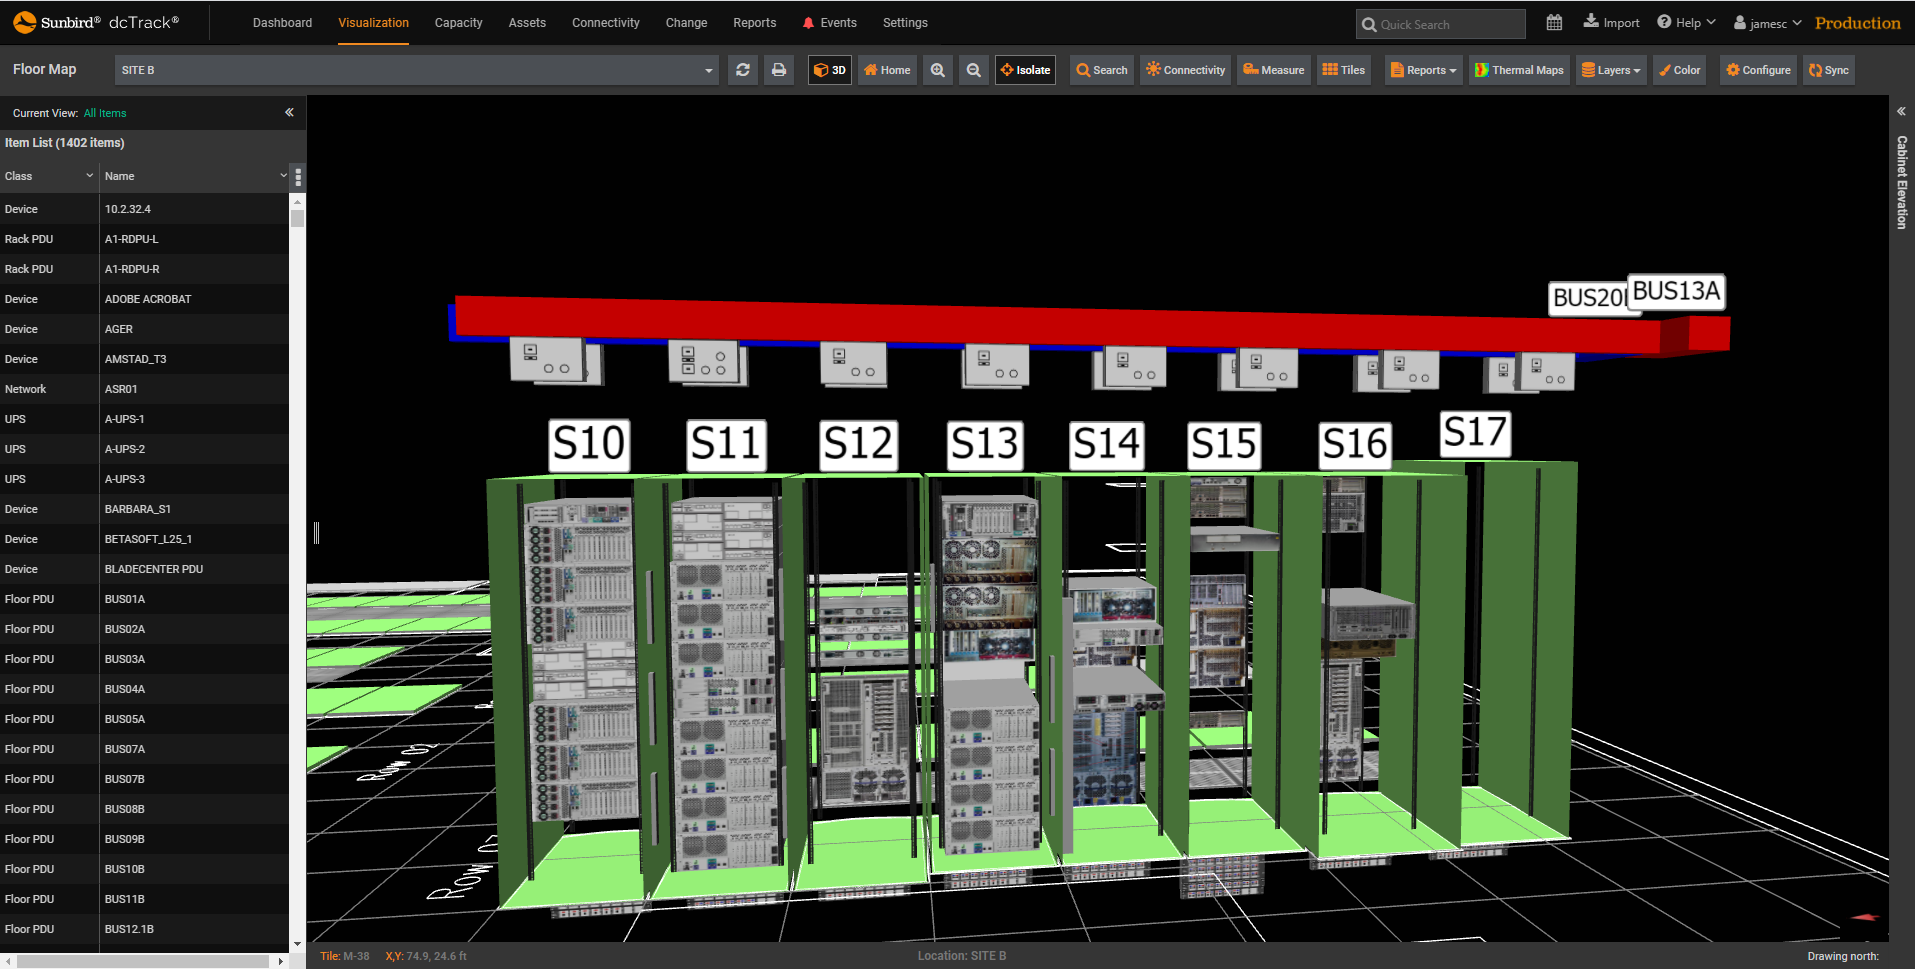
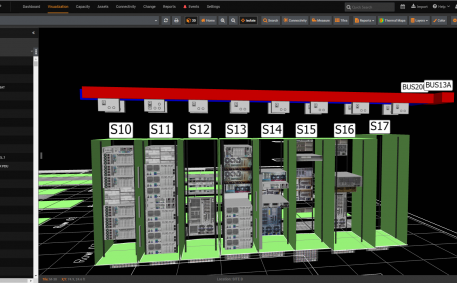
    Remotely visualize your busways, meter locations, racks, and IT equipment on your data center floor map in 3D. At a glance, know the make, model, status, and connections of your busway infrastructure.

    dcTrack DCIM Operations | Visualization
    3D Visualization of Busway Infrastructure
  • Full Details of Each Busway
    Full Details of Each Busway
    Full Details of Each Busway

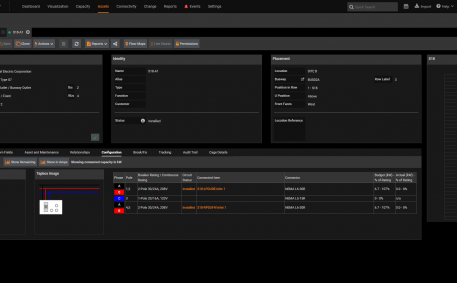
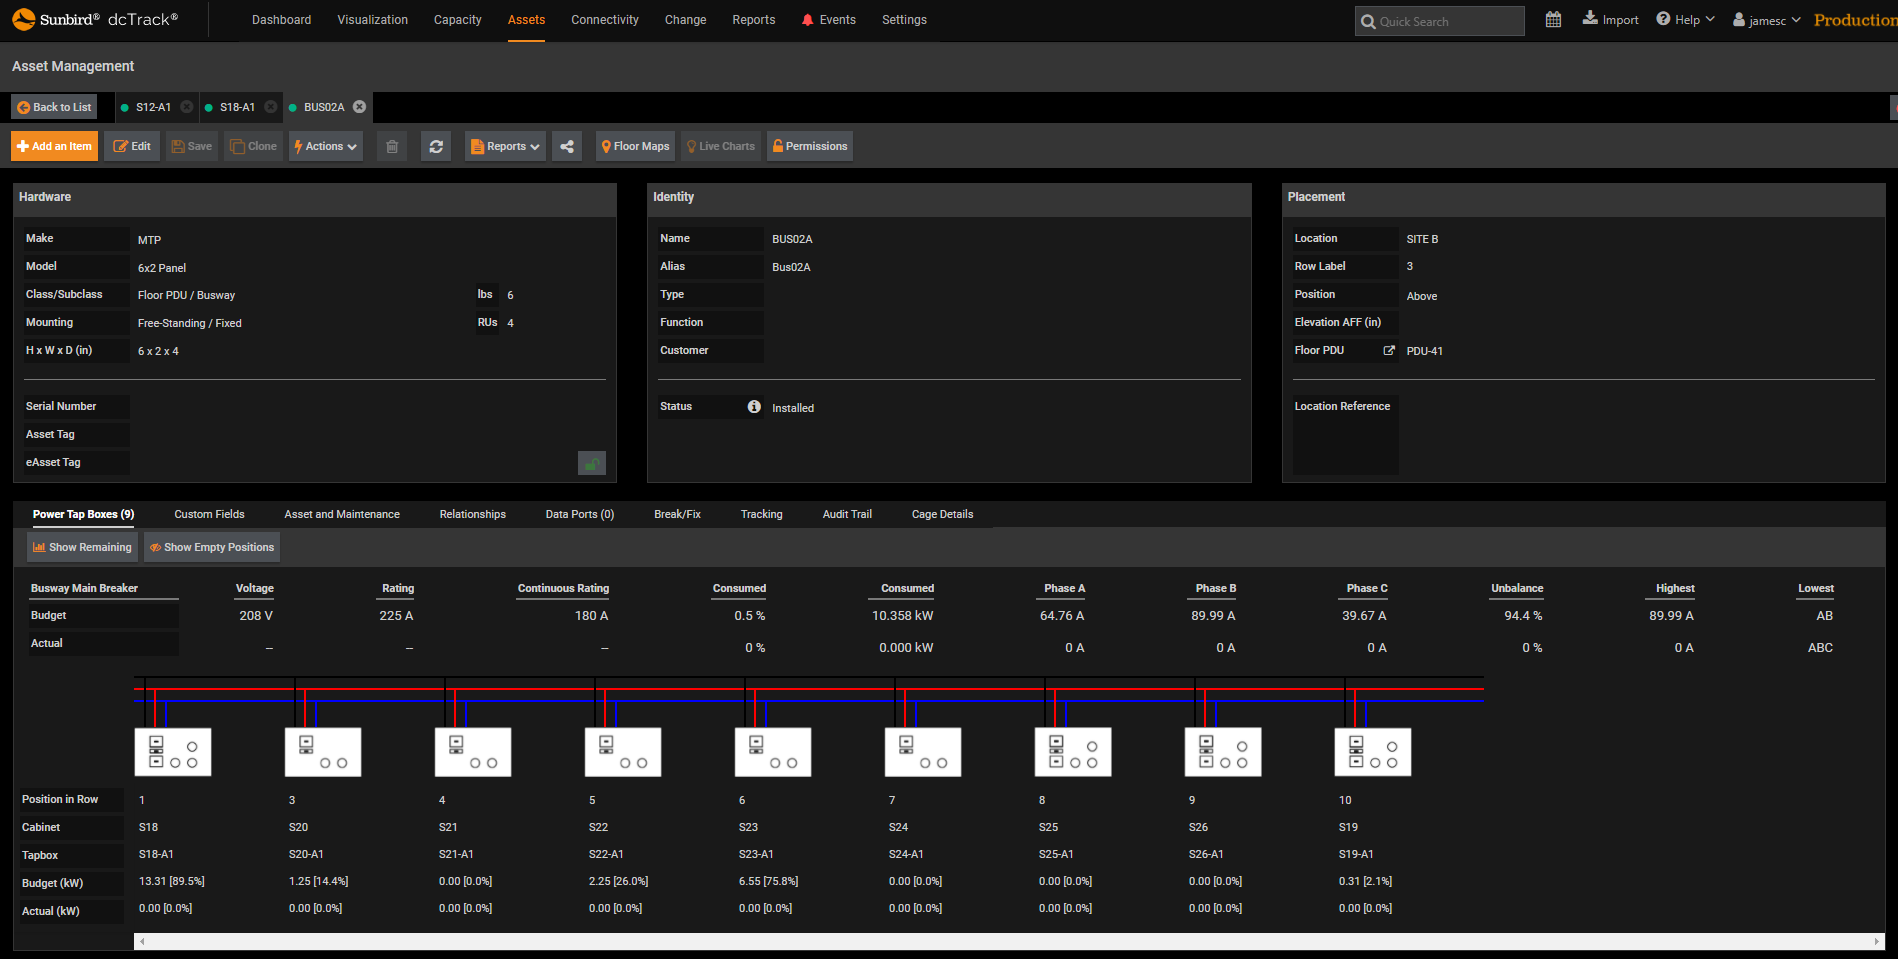
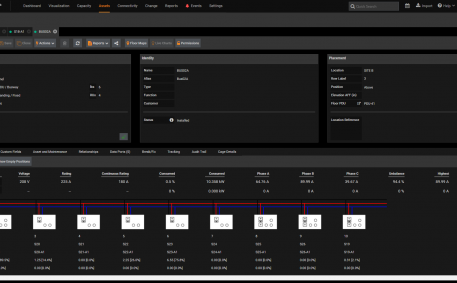
    Accurately manage busway assets with the ability to track and report on all standard and custom fields. Leverage measured readings to get the most utilization out of your power capacity. Track the budget and actual load for each tap box, the voltage rating and consumed power capacity for each busway main breaker, and the current for each of the three phases with the percentage unbalanced, the highest phase, and the lowest phase.

    dcTrack DCIM Operations | Asset Management | Capacity Management
    Full Details of Each Busway
  • Full Details of Each Tap Box
    Full Details of Each Tap Box
    Full Details of Each Tap Box

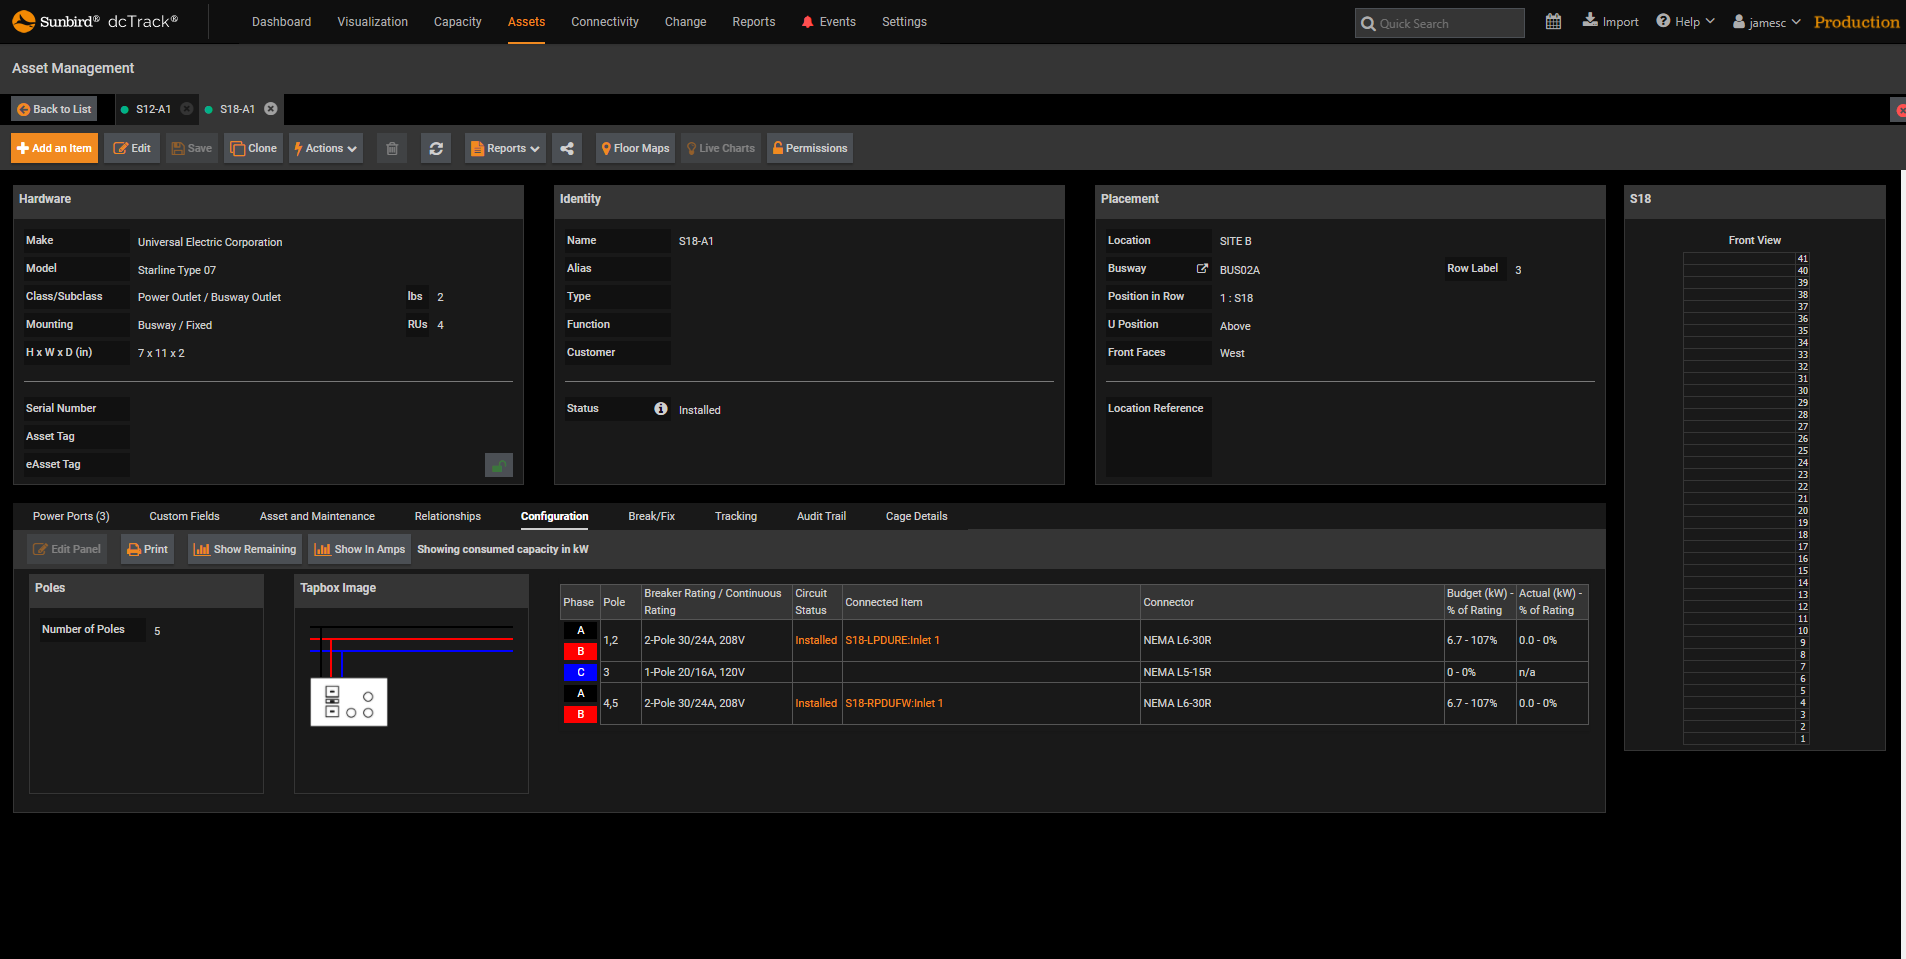
    Track the full item details of your tap boxes, including reportable standard and custom fields. Understand the number of poles, phase of each pole, breaker rating, circuit status, and connections. Capacity management is made easy with live readings that provide the percent power utilization of busway capacity.

    dcTrack DCIM Operations | Asset Management | Capacity Management
    Full Details of Each Tap Box
  • Busway Utilization Dashboard Chart
    Busway Utilization Dashboard Chart
    Busway Utilization Dashboard Chart

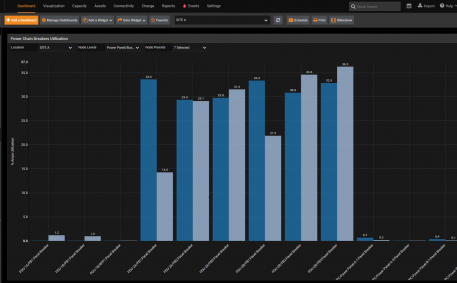
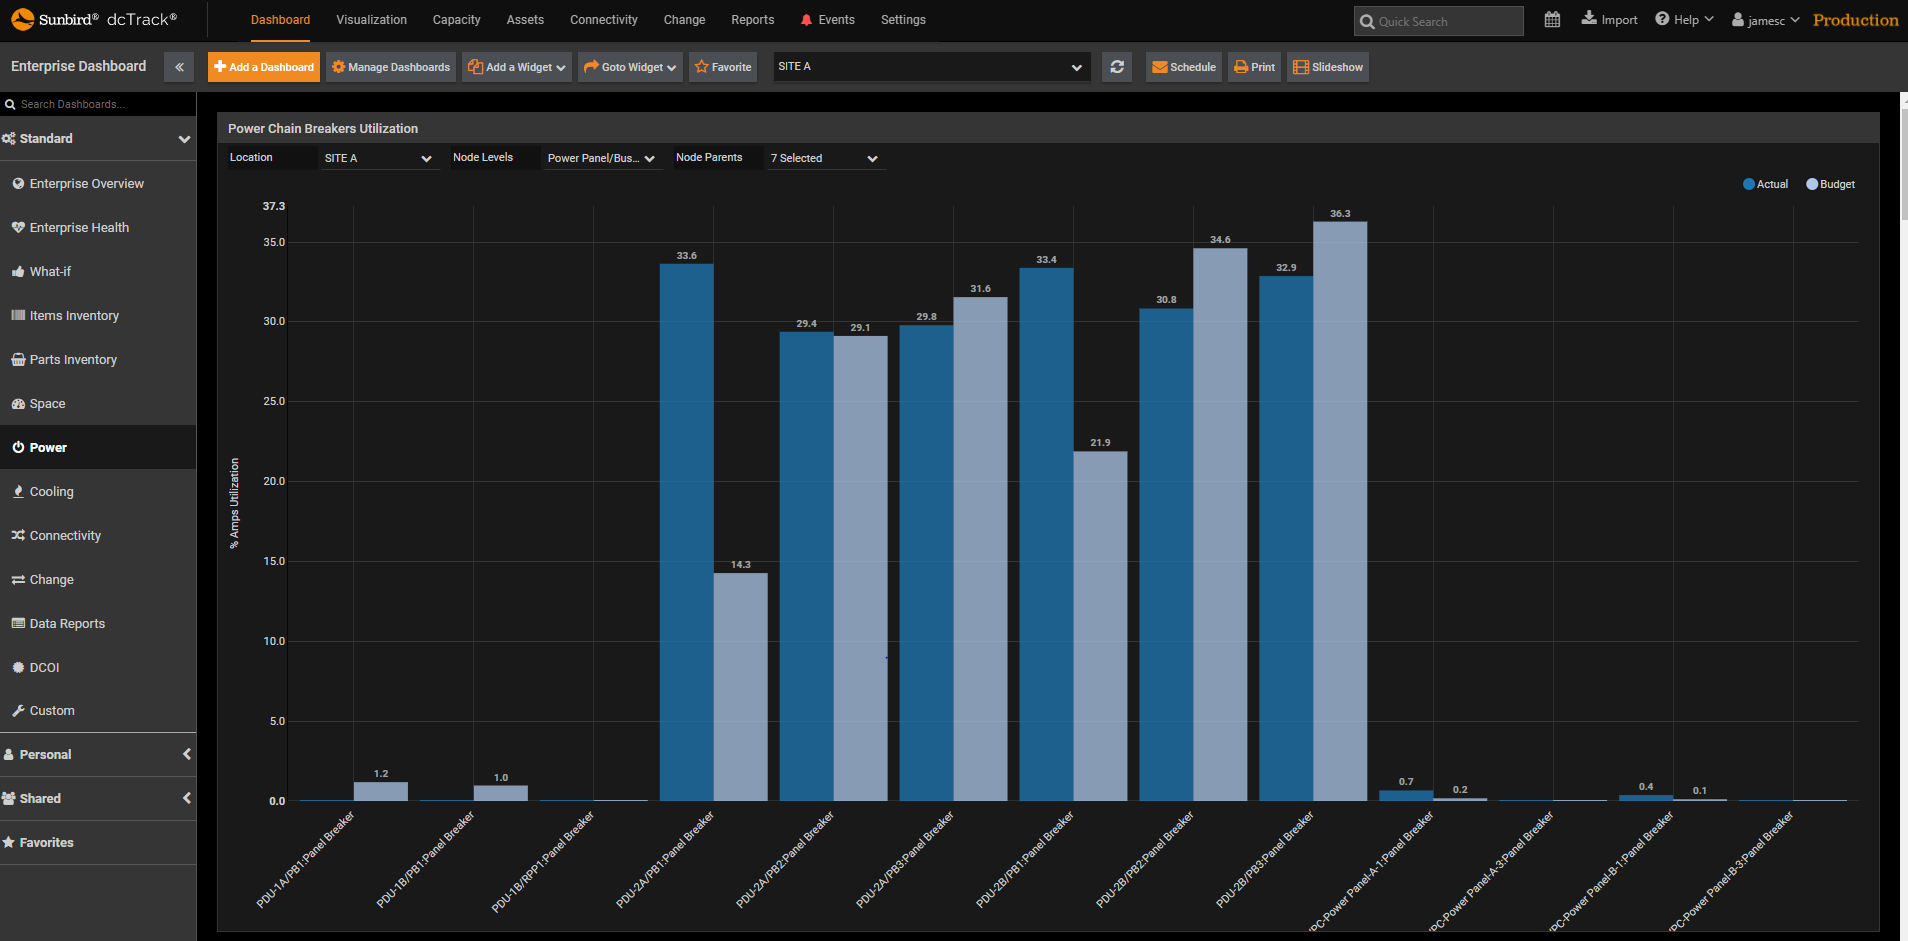
    Monitor the budget and actual power utilization for all your busways in one easy-to-understand dashboard chart. Know if you are overloading a busway which may cause downtime or if you are underutilizing a busway which results in you not getting the most out of your power resources.

    dcTrack DCIM Operations | Capacity Management | Dashboards
    Busway Utilization Dashboard Chart
  • Screenshot of Parts Transactions
    Screenshot of Parts Transactions
    Parts Transactions

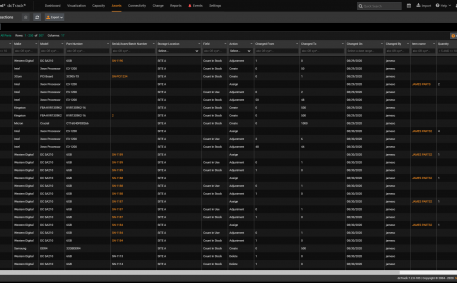
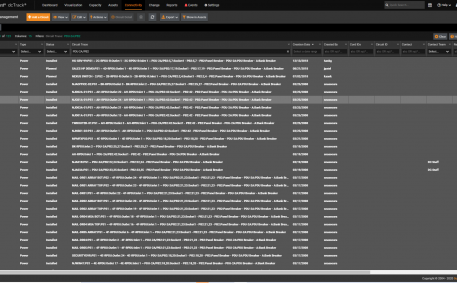
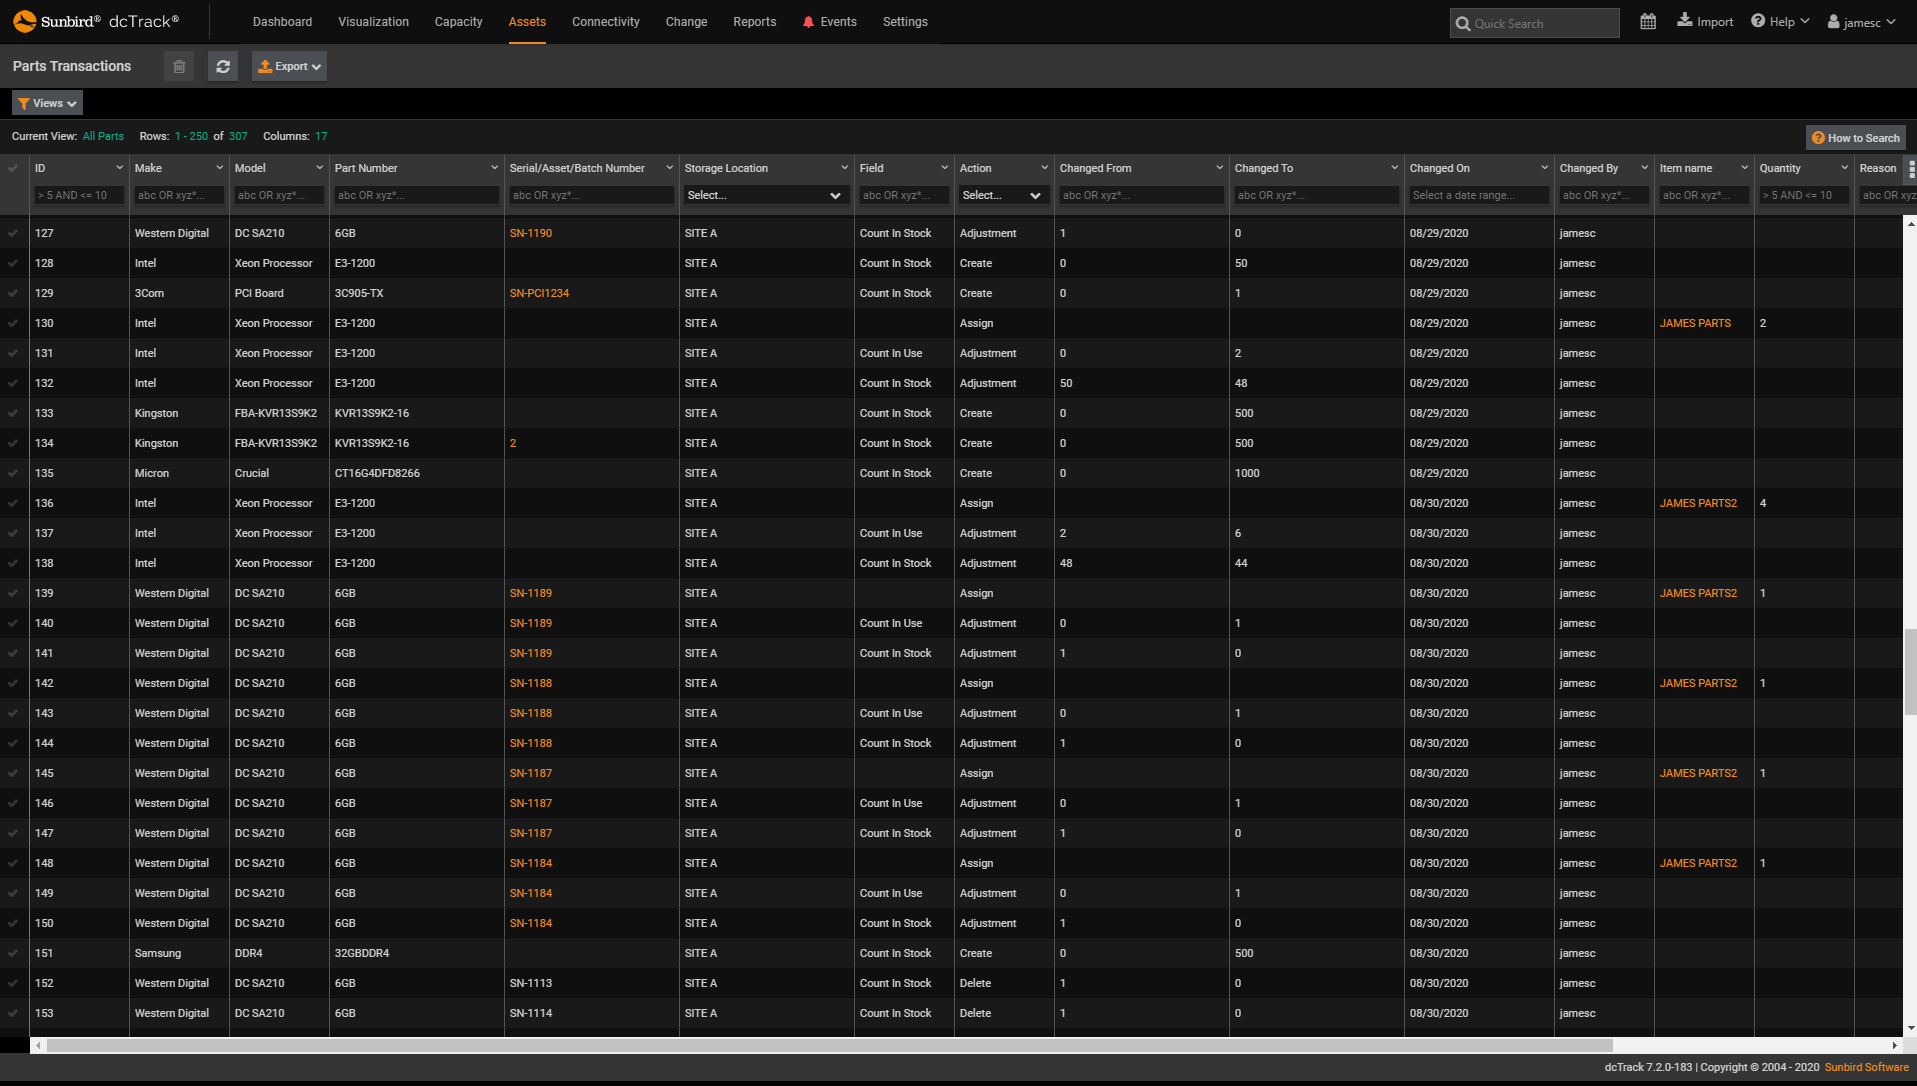
    Sunbird provides complete transparency with a fully searchable, sortable, and exportable audit log of all parts transactions.

    dcTrack DCIM Operations | Asset Management
    Parts Transactions
  • Screenshot of Parts Custom Fields
    Screenshot of Parts Custom Fields
    Parts Custom Fields

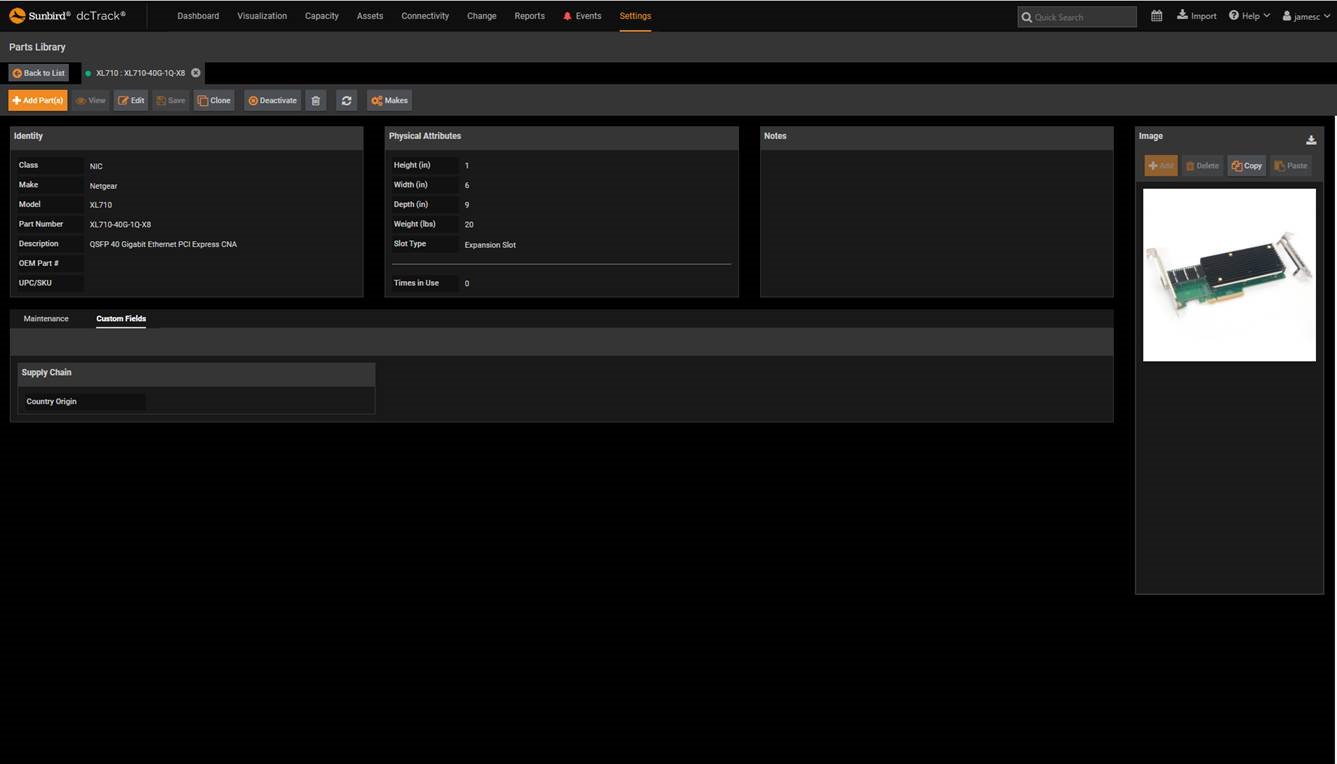
    Custom fields allow you to track any attribute about a part that you desire to make it easy to keep tabs on what’s important to you.

    dcTrack DCIM Operations | Asset Management
    Parts Custom Fields
  • Screenshot of Spare Parts
    Screenshot of Spare Parts
    Spare Parts

    Sunbird makes it simple for you to manage high-value inventory items, monitor the supply of spare parts, and be alerted when you run below preset thresholds.

    dcTrack DCIM Operations | Asset Management
    Spare Parts
  • Screenshot of Parts Templates
    Screenshot of Parts Templates
    Parts Templates

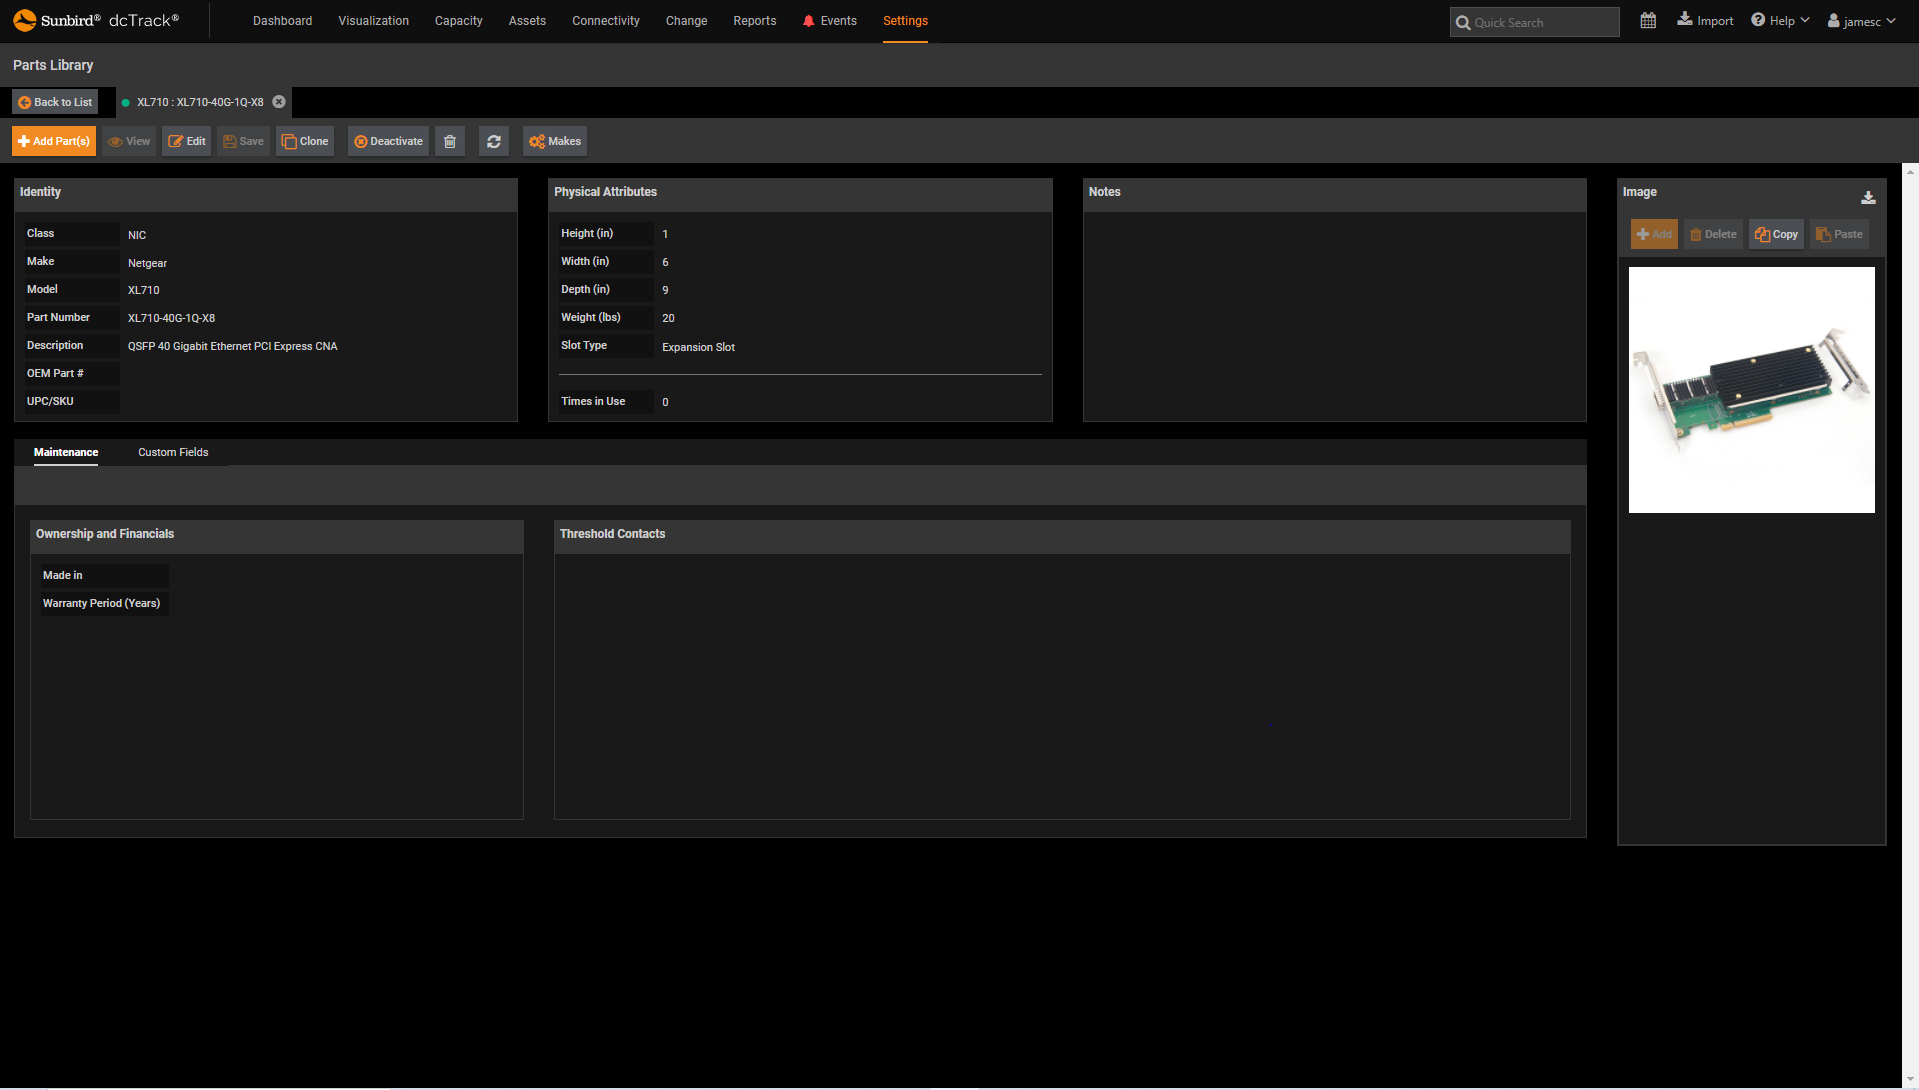
    Build your own inventory of parts and create your own parts library with customizable parts templates, a flexible feature that allows you to define the parts you want to track and which asset they are associated with.

    dcTrack DCIM Operations | Asset Management
    Parts Templates
  • Screenshot of End to End DC Power Chain
    Screenshot of End to End DC Power Chain
    End to End DC Power Chain

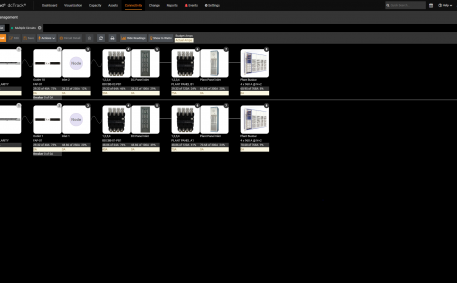
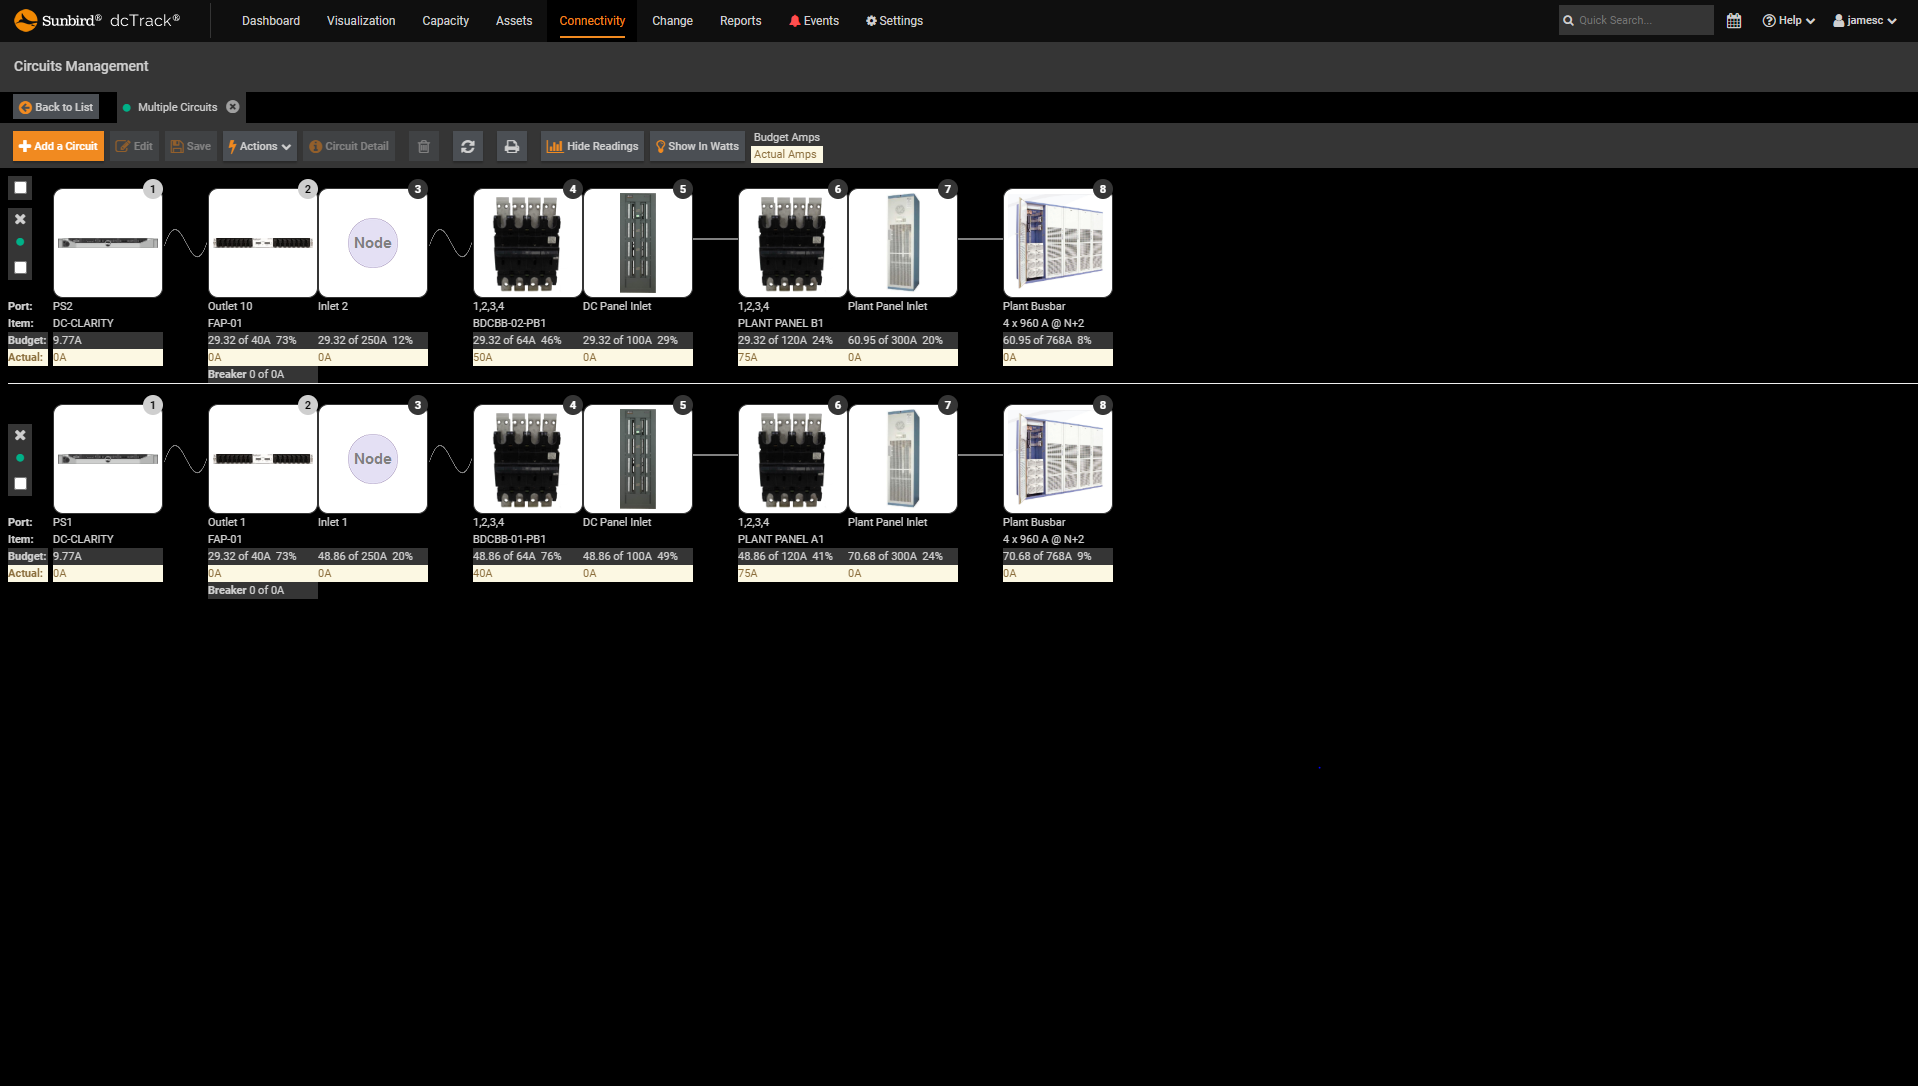
    Visualize your end to end DC power chain including your plant, panel, BDCBB, FAP, etc.

    dcTrack DCIM Operations | Connectivity
    End to End DC Power Chain
  • Screenshot of Direct Current Power Chain Utilization
    Screenshot of Direct Current Power Chain Utilization
    Direct Current Power Chain Utilization

    Manage your DC power chain utilization with actual measured loads

    dcTrack DCIM Operations | Connectivity
    Direct Current Power Chain Utilization
  • Screenshot of See Any Item Field in Color
    Screenshot of See Any Item Field in Color
    See Any Item Field in Color at the Rack and Item Level
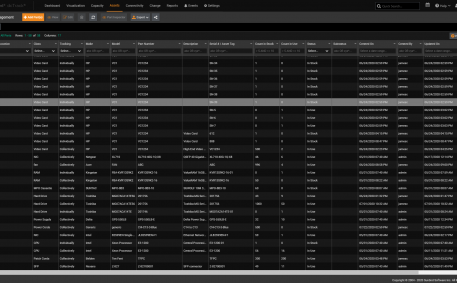
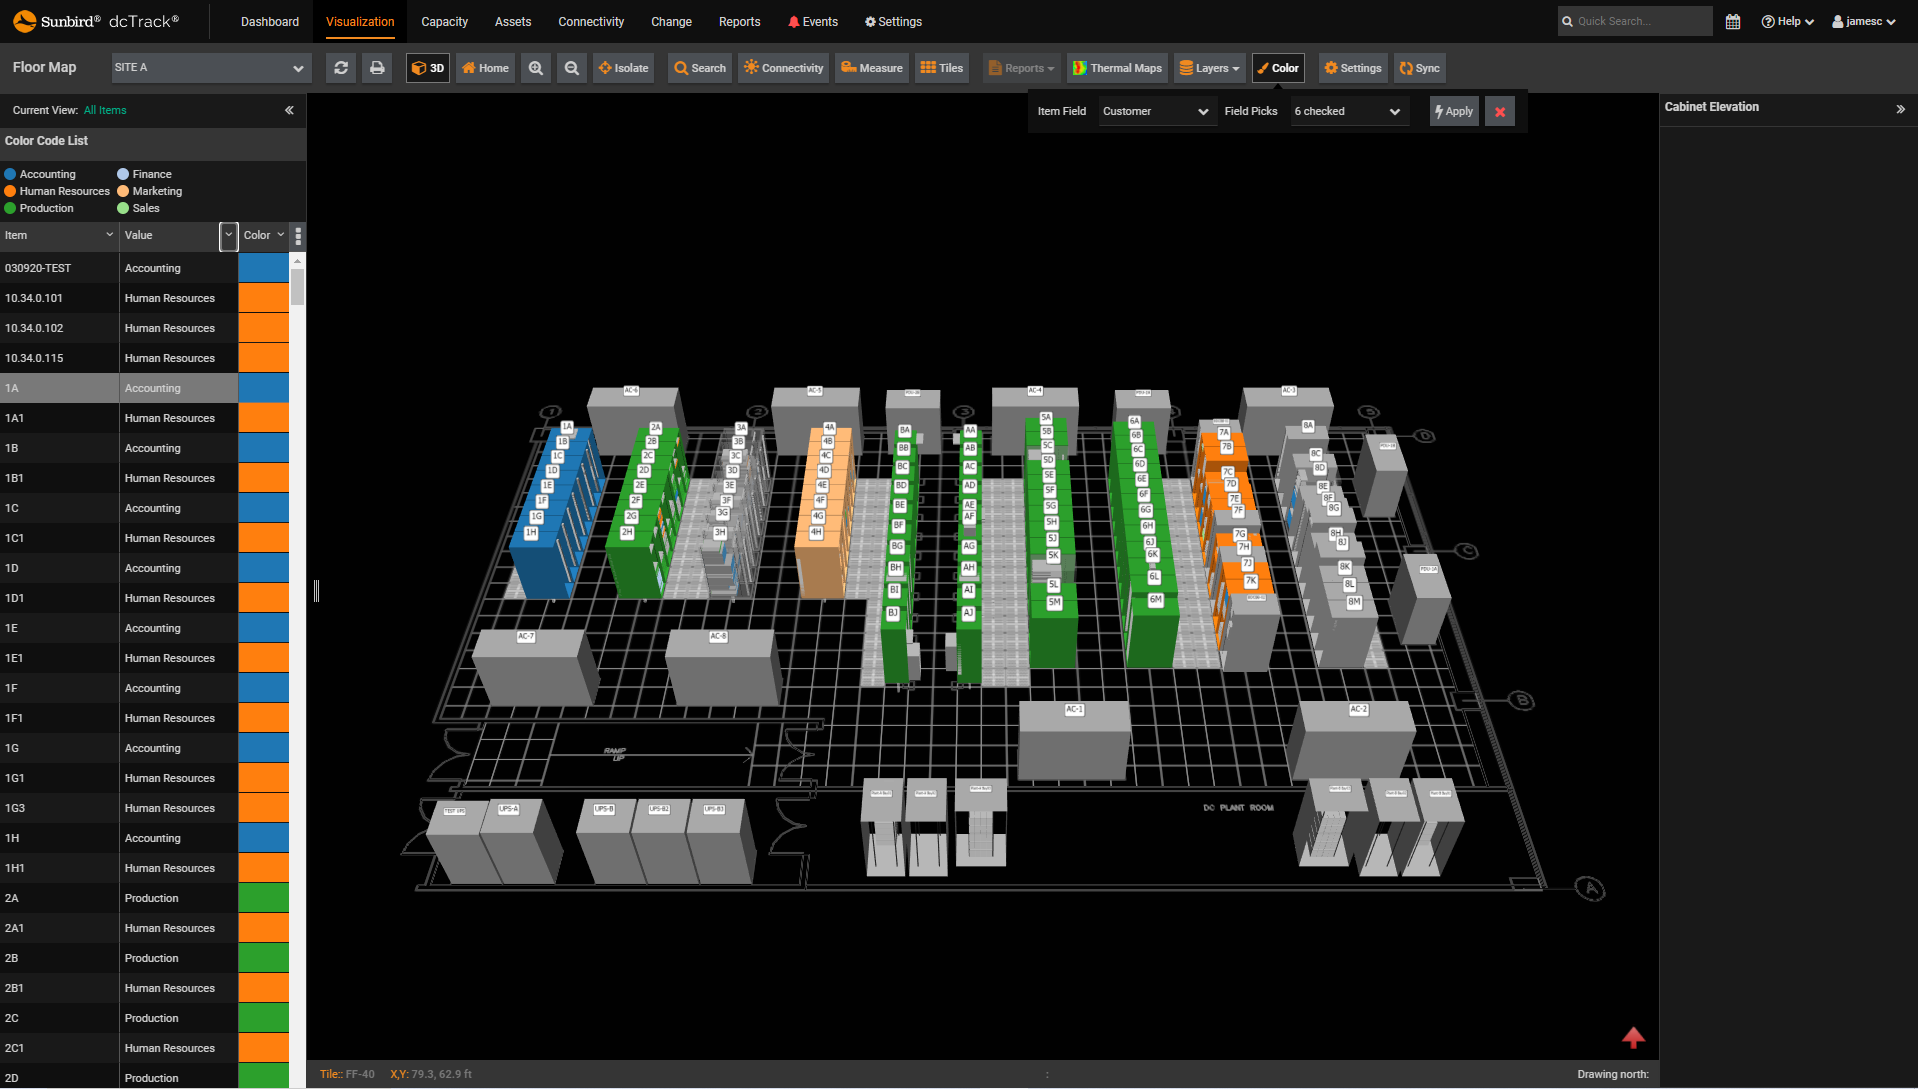
    In this example, see a view of customers by color.

    dcTrack DCIM Operations | Asset Management
    See Any Item Field in Color at the Rack and Item Level
  • Screenshot of Parts Management
    Screenshot of Parts Management
    Parts Management

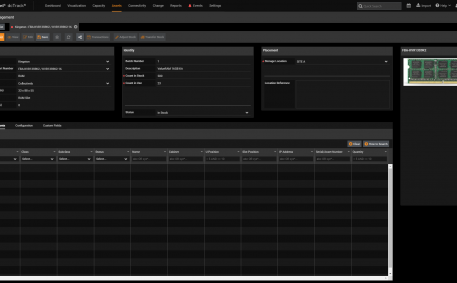
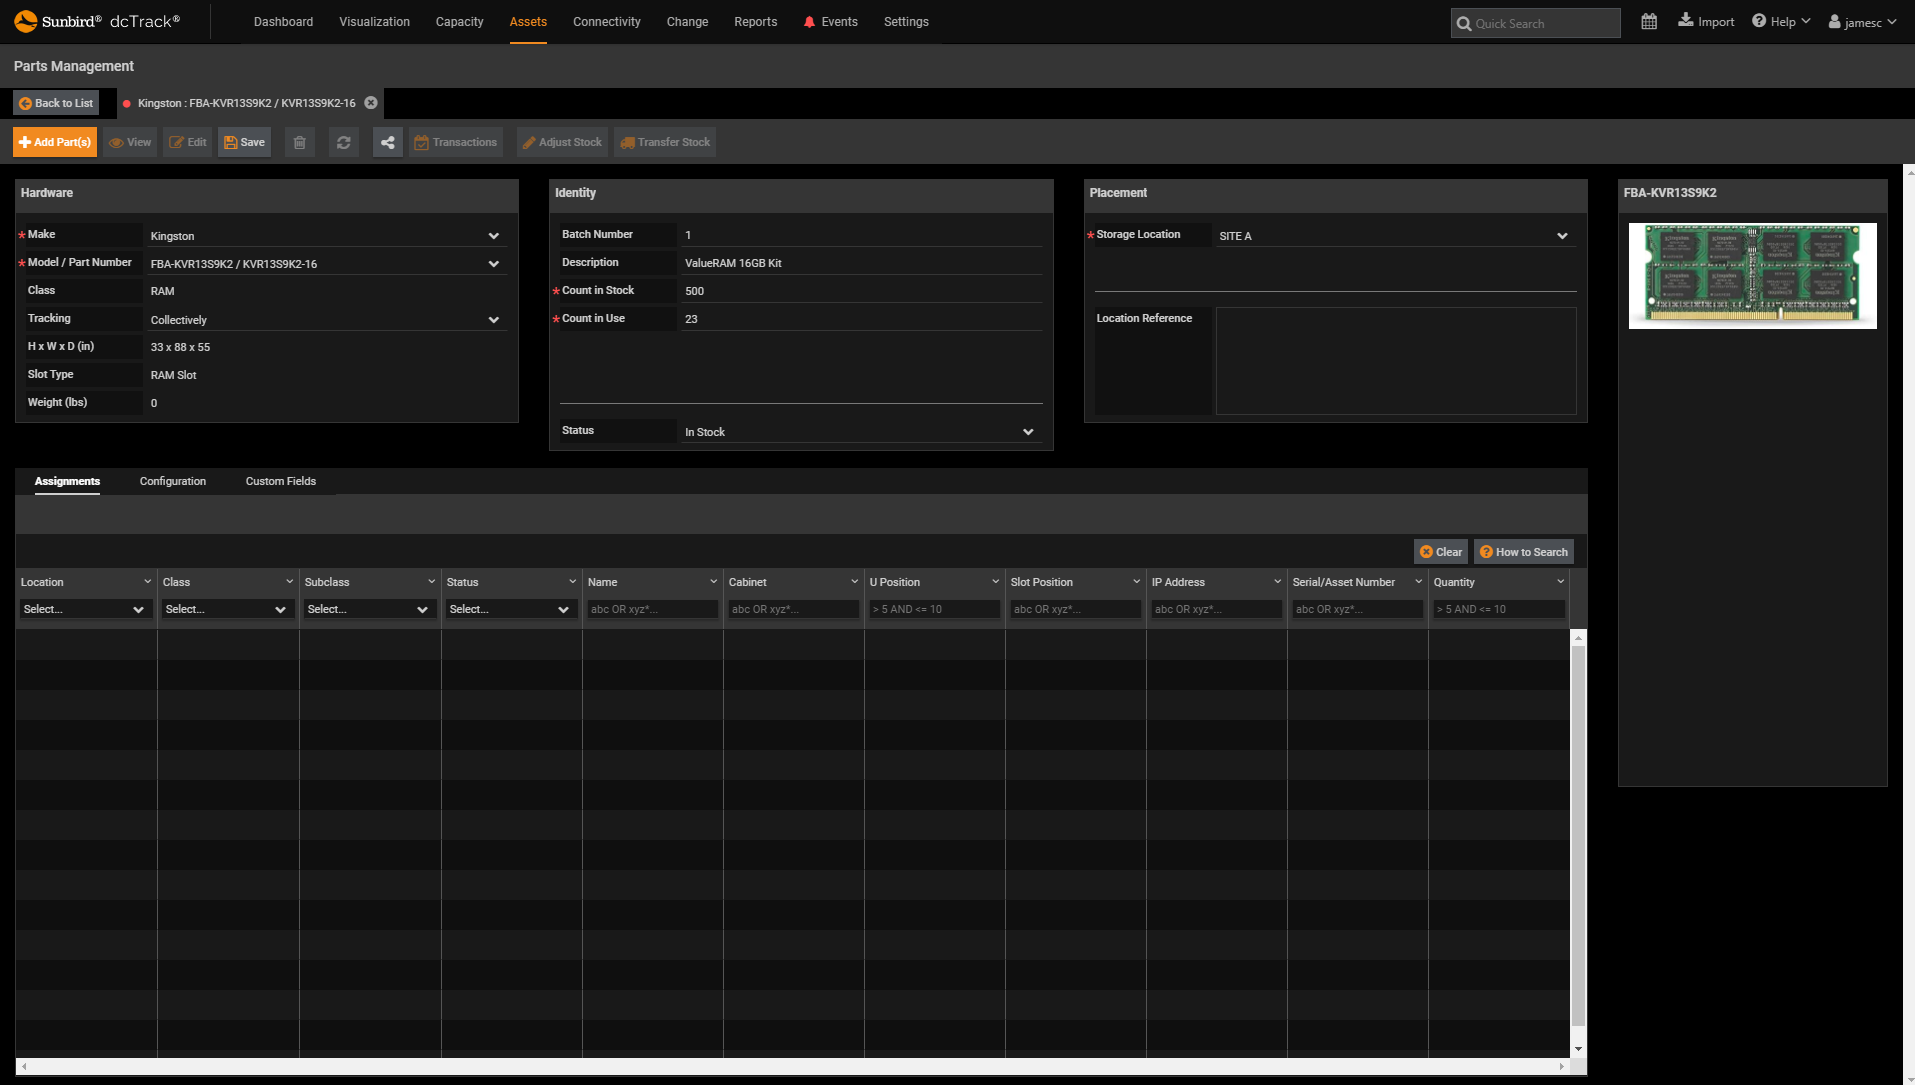
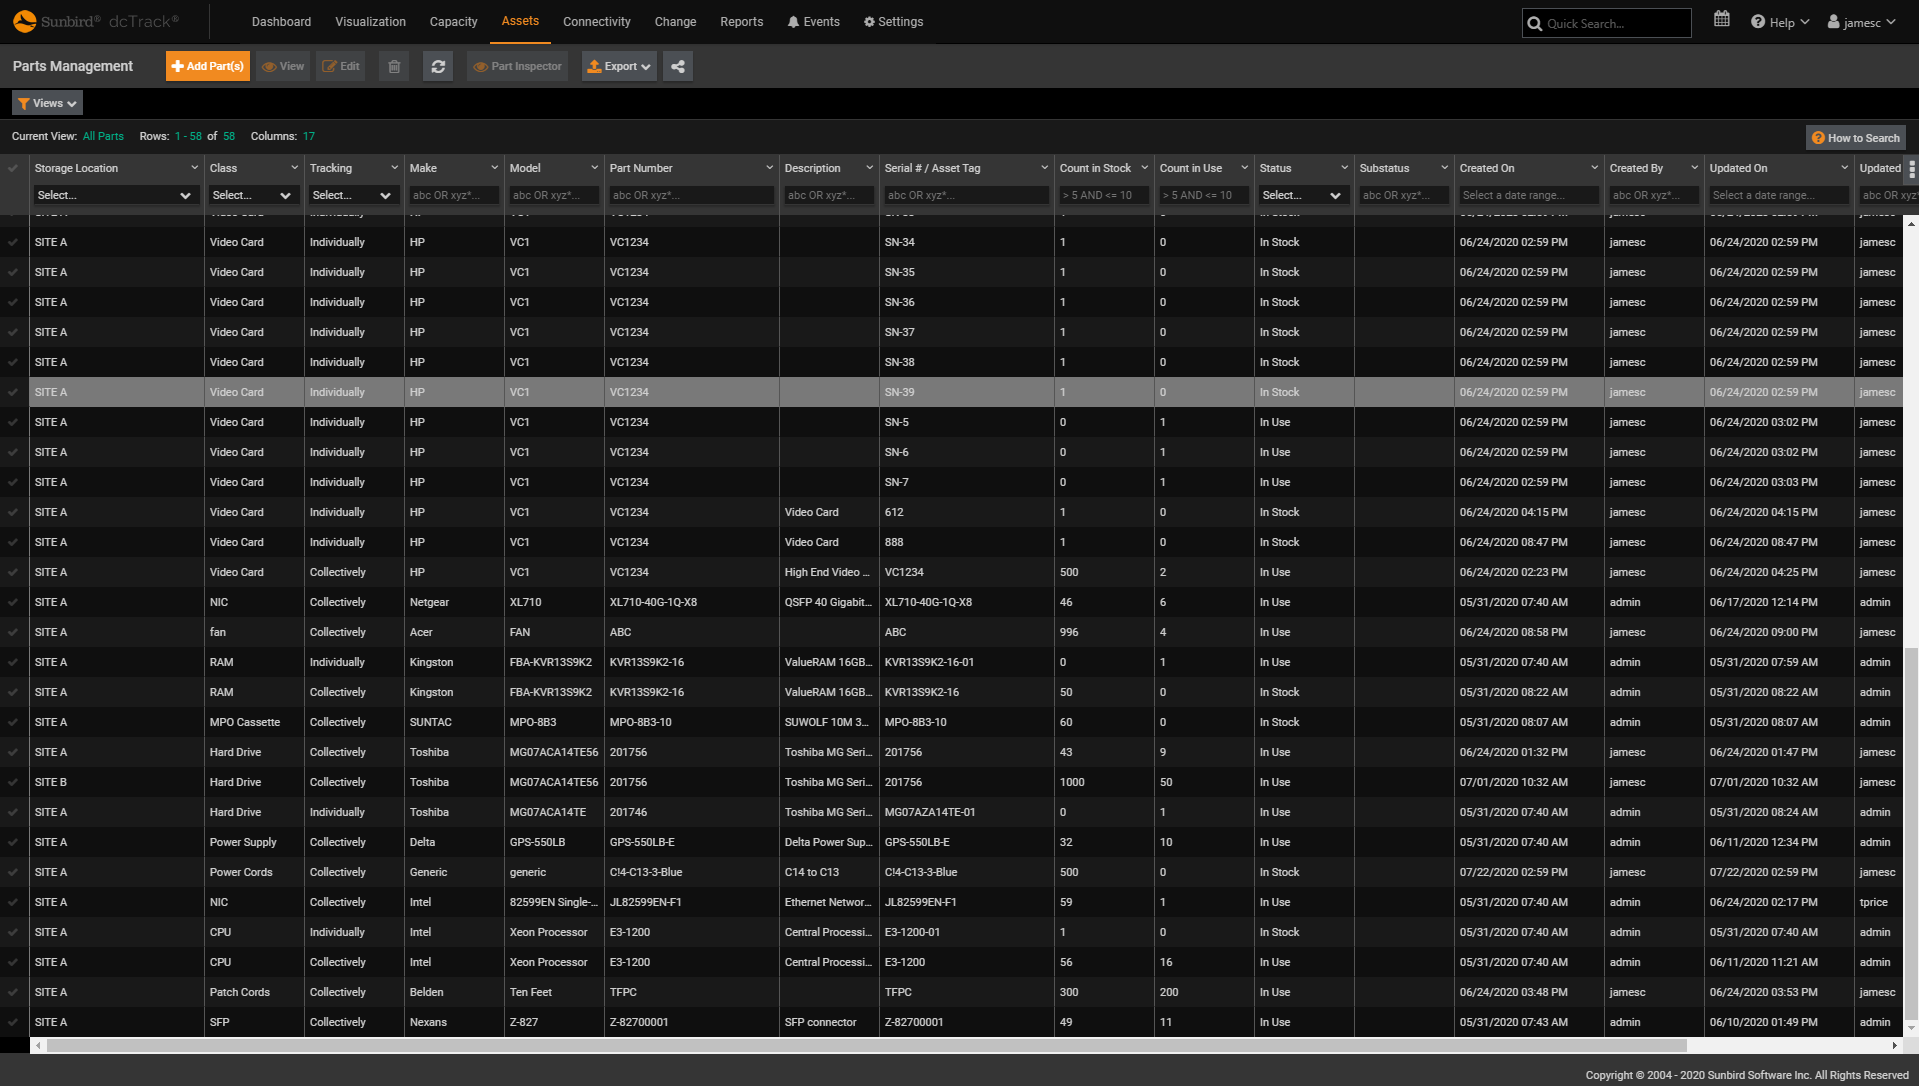
    Track all your parts in one window. Know count in use and in stock.

    dcTrack DCIM Operations | Asset Management
    Parts Management
  • Screenshot of Impact Analysis From Any Point in a Data or Power Circuit
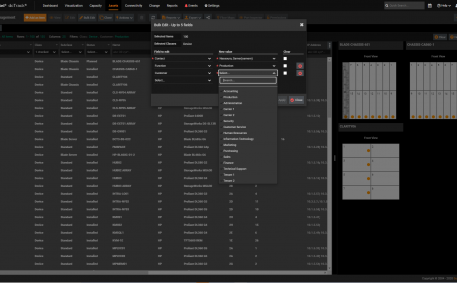
    Screenshot of Impact Analysis From Any Point in a Data or Power Circuit
    Impact Analysis From Any Point in a Data or Power Circuit

    Conduct impact analysis from any point in a data circuit or power circuit

    dcTrack DCIM Operations | Connectivity
    Impact Analysis From Any Point in a Data or Power Circuit
  • Screenshot of Bulk Edit Item Attributes
    Screenshot of Bulk Edit Item Attributes
    Bulk Edit Item Attributes

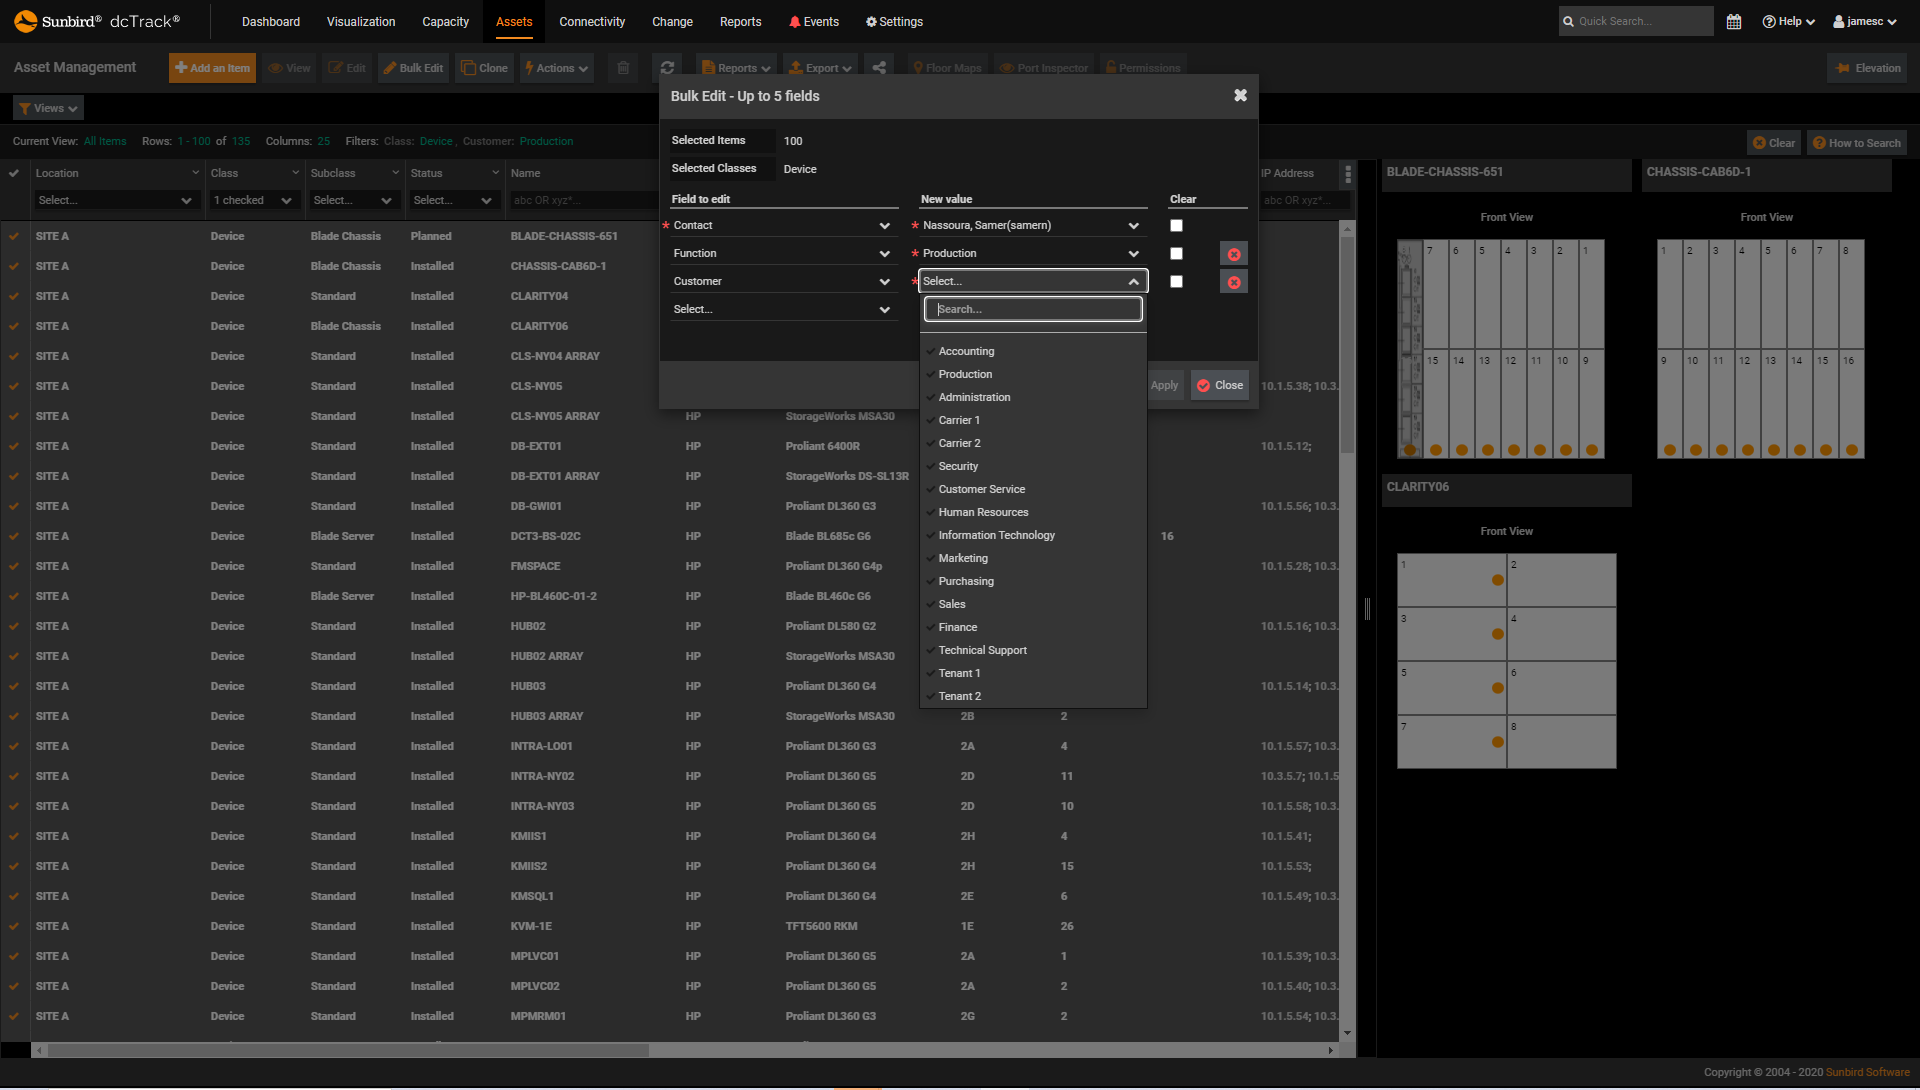
    Bulk edit up to 5 fields from the GUI

    dcTrack DCIM Operations | Asset Management
    Bulk Edit Item Attributes
  • Screenshot of Cabinet Inspector
    Screenshot of Cabinet Inspector
    Cabinet Inspector

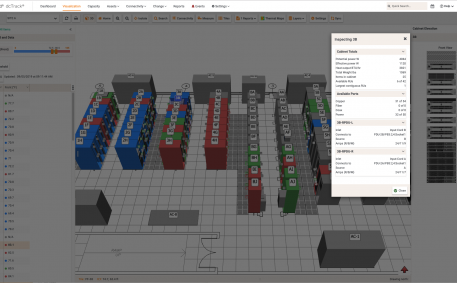
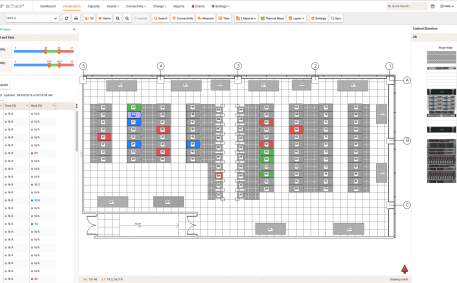
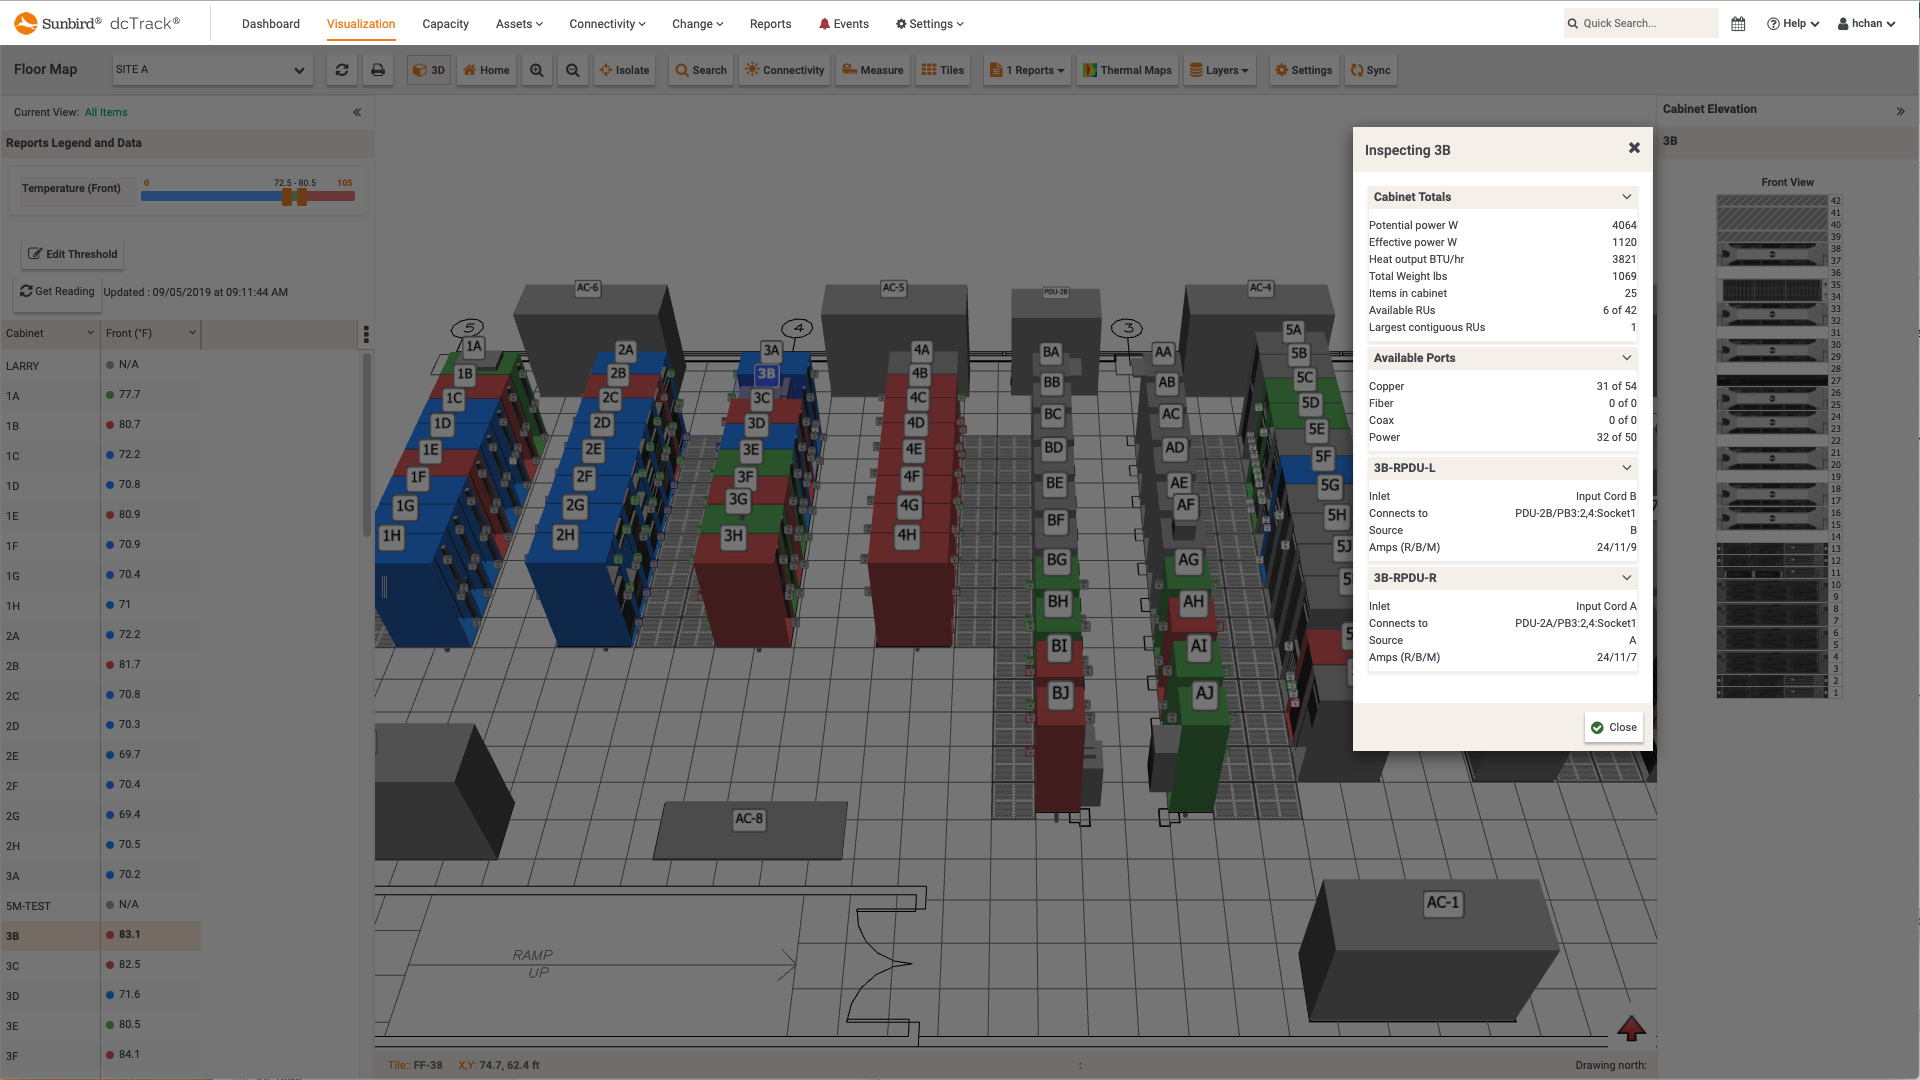
    Quickly see cabinet details while navigating the floor map.

    dcTrack DCIM Operations | Asset Management | Visualization
    Cabinet Inspector
  • Screenshot of Cabinet Inlet Temperature Report
    Screenshot of Cabinet Inlet Temperature Report
    Cabinet Inlet Temperature Report

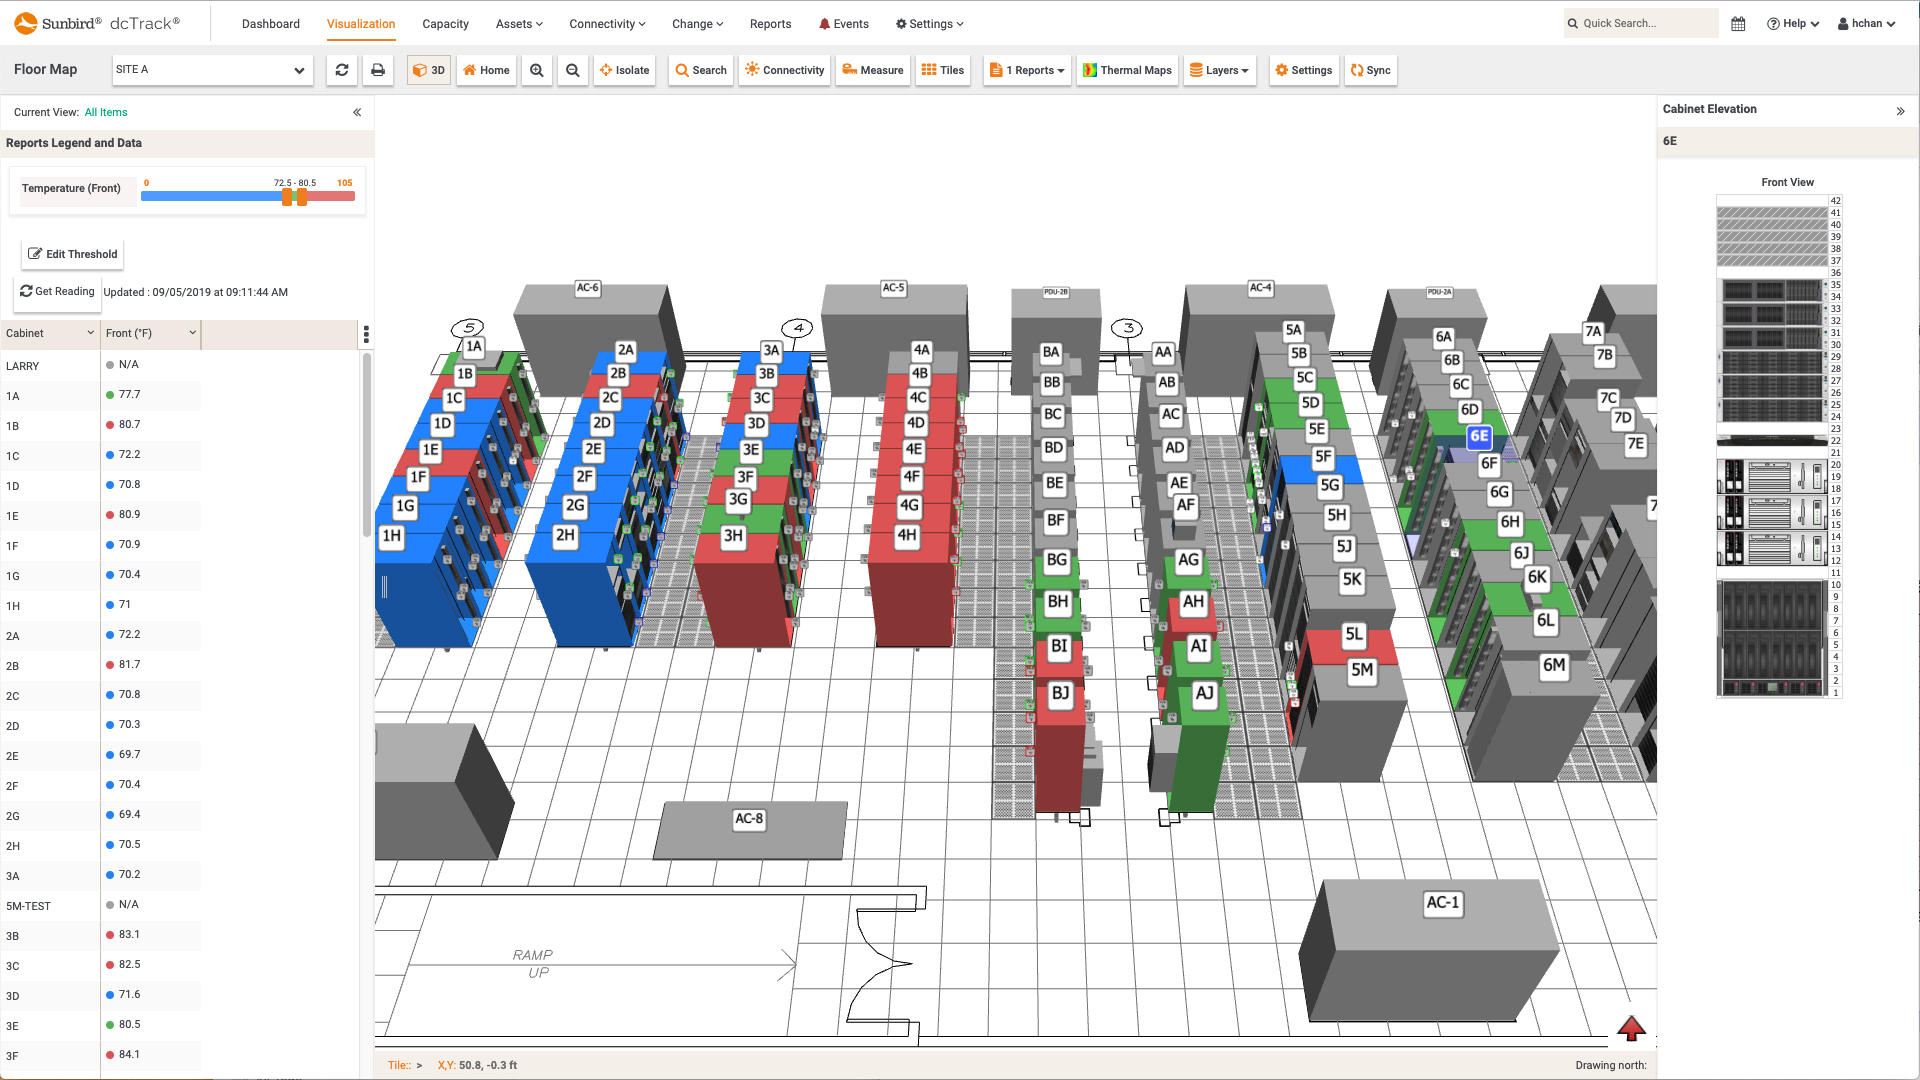
    The Max Temperature per Cabinet Fronts floor map report displays the maximum of all temperature sensors at the front of the cabinet.

    dcTrack DCIM Operations | Environment Management | Visualization
    Cabinet Inlet Temperature Report
  • Screenshot of Circuits Management
    Screenshot of Circuits Management
    Circuits Management

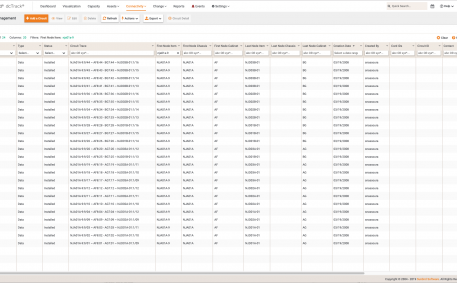
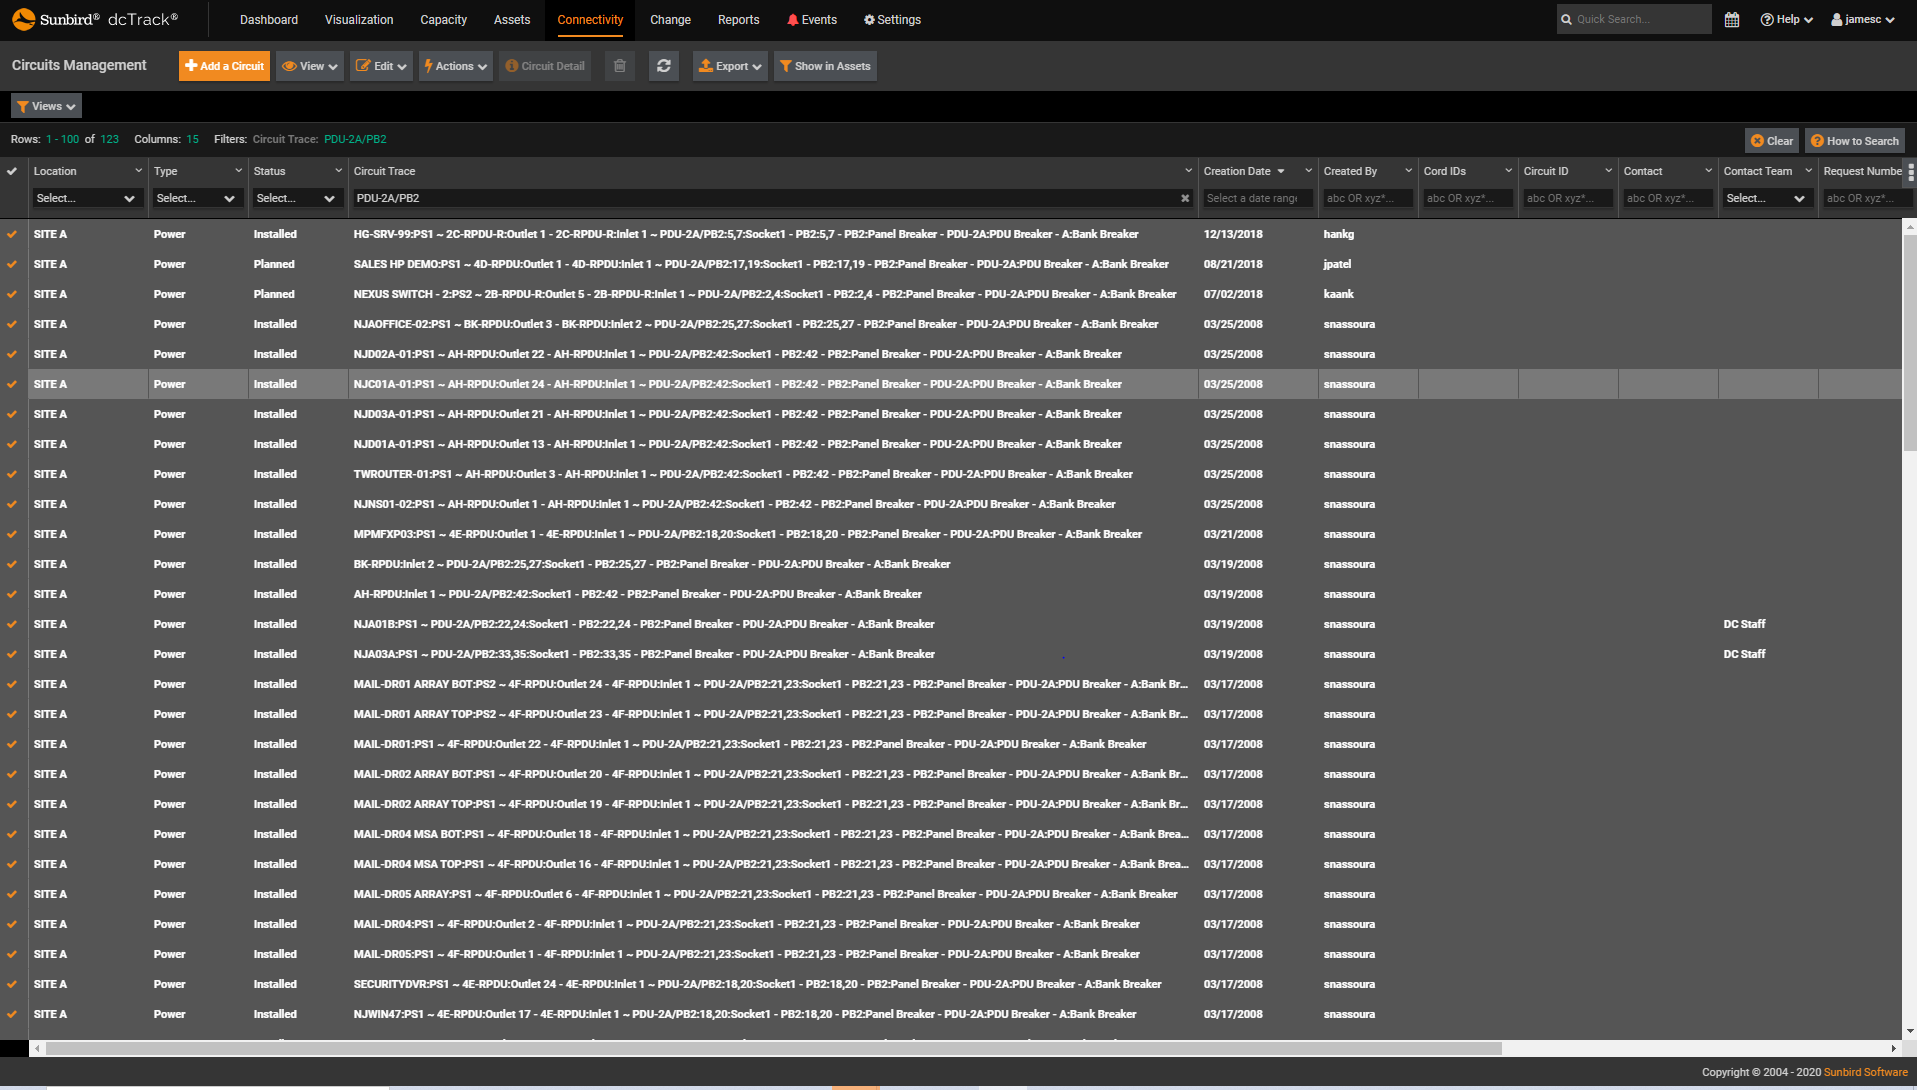
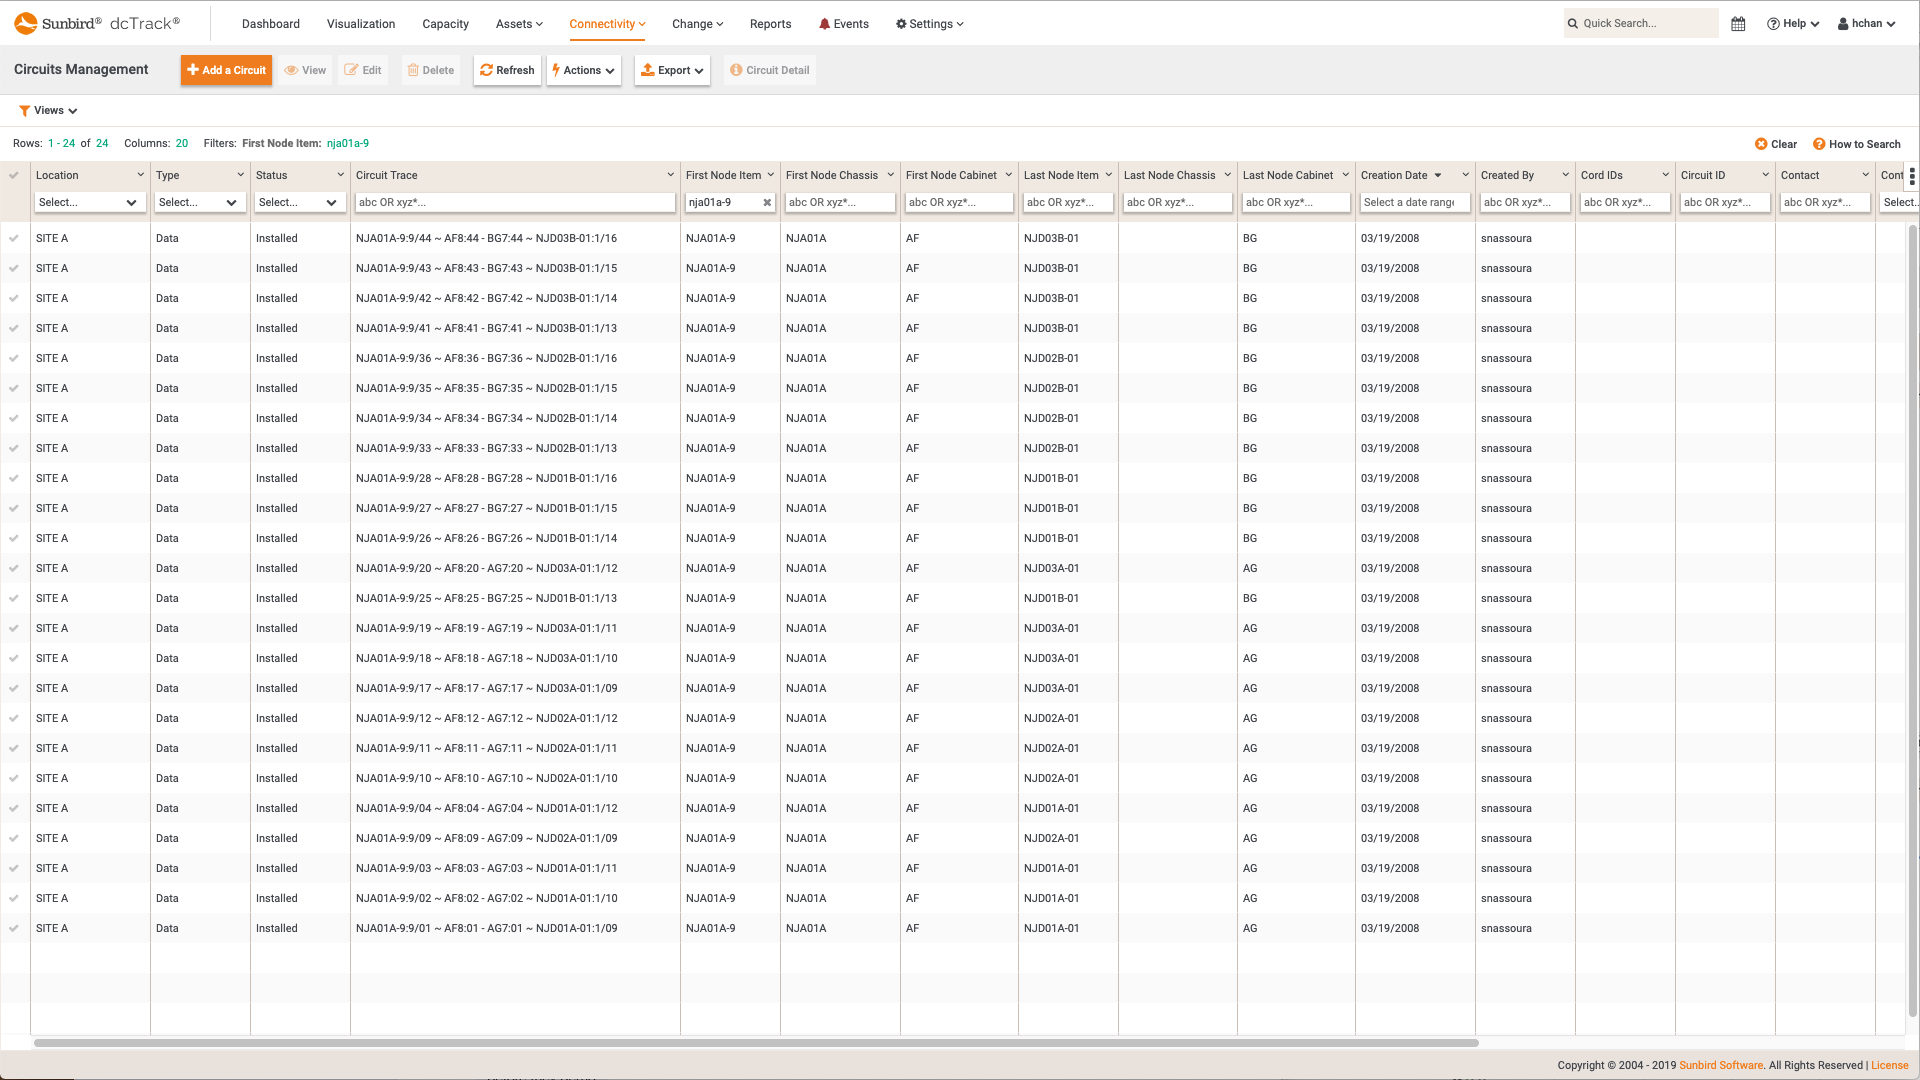
    View all circuits with information on Type, Status, First and Last Node Item/Chassis/Cabinet, and more.

    dcTrack DCIM Operations | BI & Data Analytics
    Circuits Management
  • Screenshot of Zero-Configuration Interactive Reports and Visual Analytics
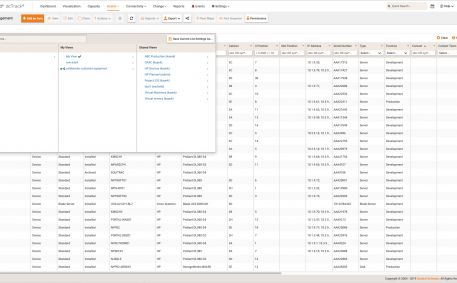
    Screenshot of Zero-Configuration Interactive Reports and Visual Analytics
    Zero-Configuration Interactive Reports and Visual Analytics

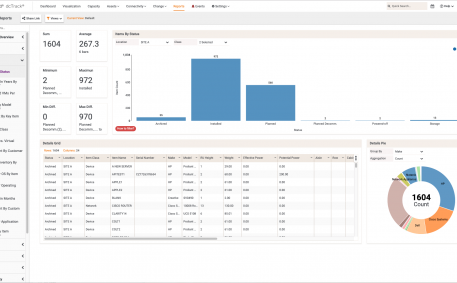
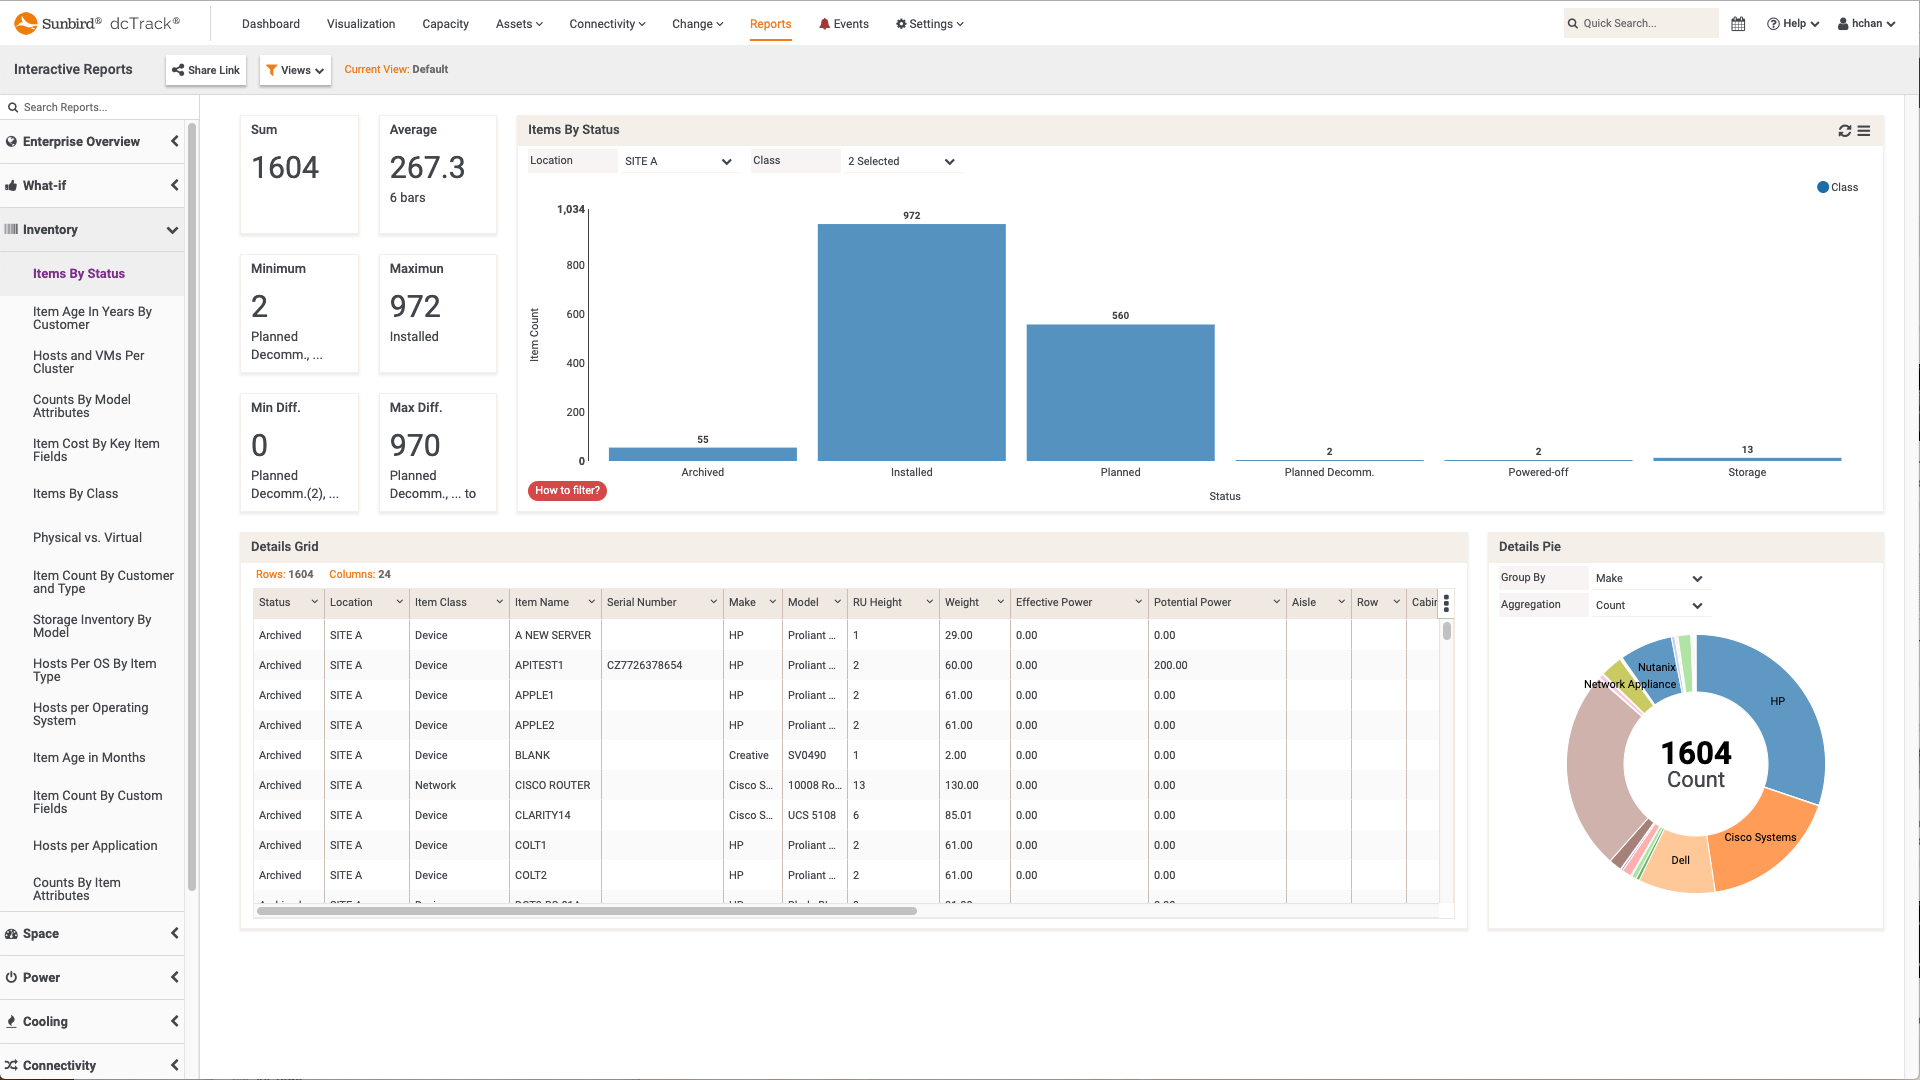
    dcTrack provides zero-configuration analytics that work out-of-the-box.

    dcTrack DCIM Operations | BI & Data Analytics | Dashboards
    Zero-Configuration Interactive Reports and Visual Analytics
  • Screenshot of Save and Share Filtered Views
    Screenshot of Save and Share Filtered Views
    Save and Share Filtered Views

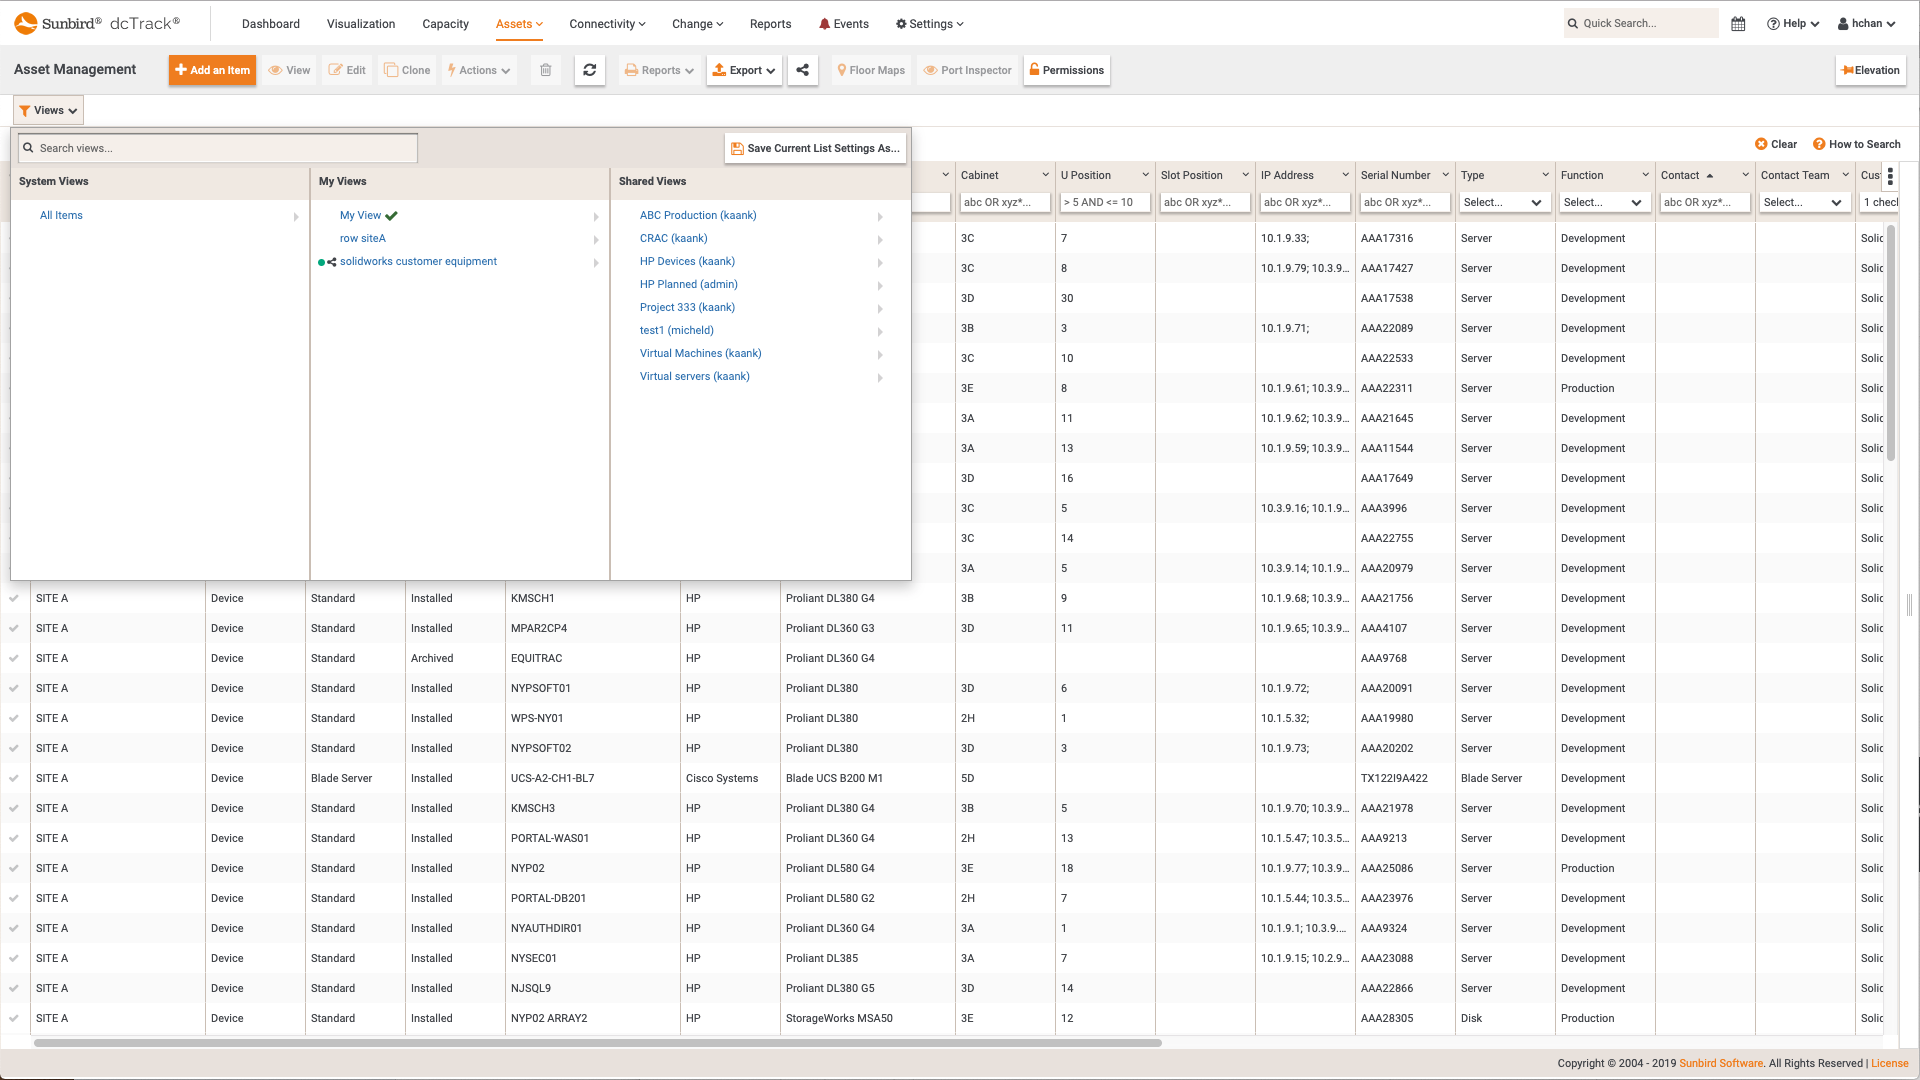
    Save and share filtered views of assets.

    dcTrack DCIM Operations | Asset Management
    Save and Share Filtered Views
  • Screenshot of Relative Humidity per Cabinet
    Screenshot of Relative Humidity per Cabinet
    Relative Humidity per Cabinet Floor Map Report
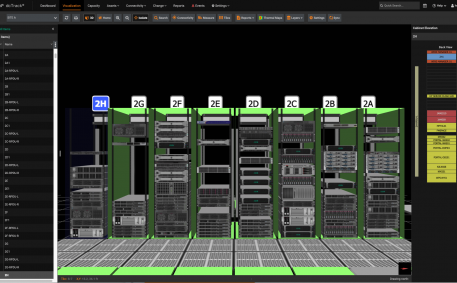
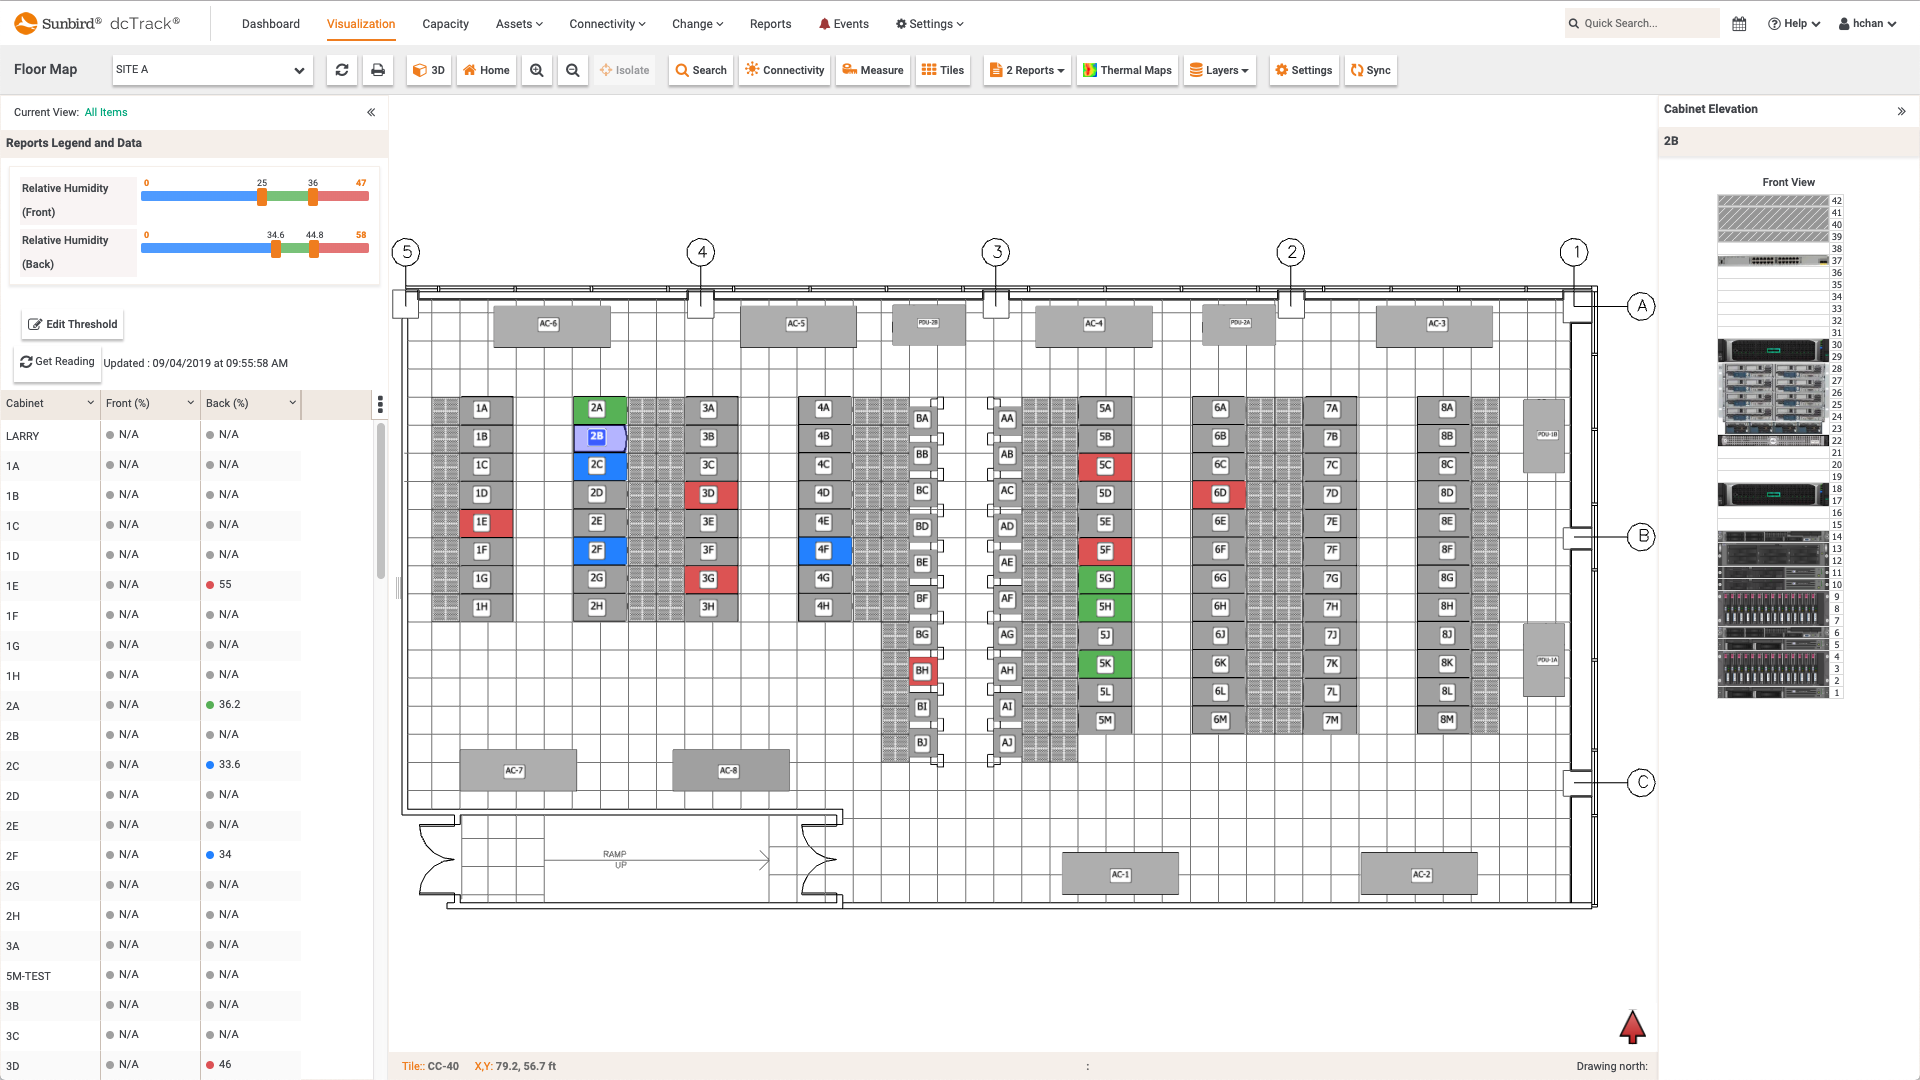
    The Relative Humidity per Cabinet floor map report displays the relative humidity of sensors at the front and back of the cabinet.

    dcTrack DCIM Operations | Environment Management | BI & Data Analytics | Visualization
    Relative Humidity per Cabinet Floor Map Report
  • Screenshot Cabinet Elevations
    Screenshot Cabinet Elevations
    Cabinet Elevations

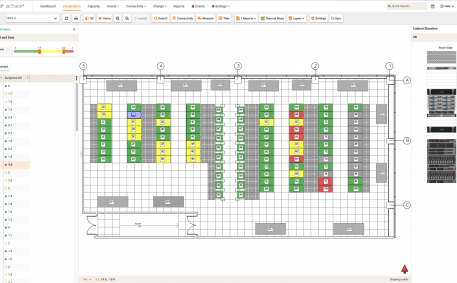
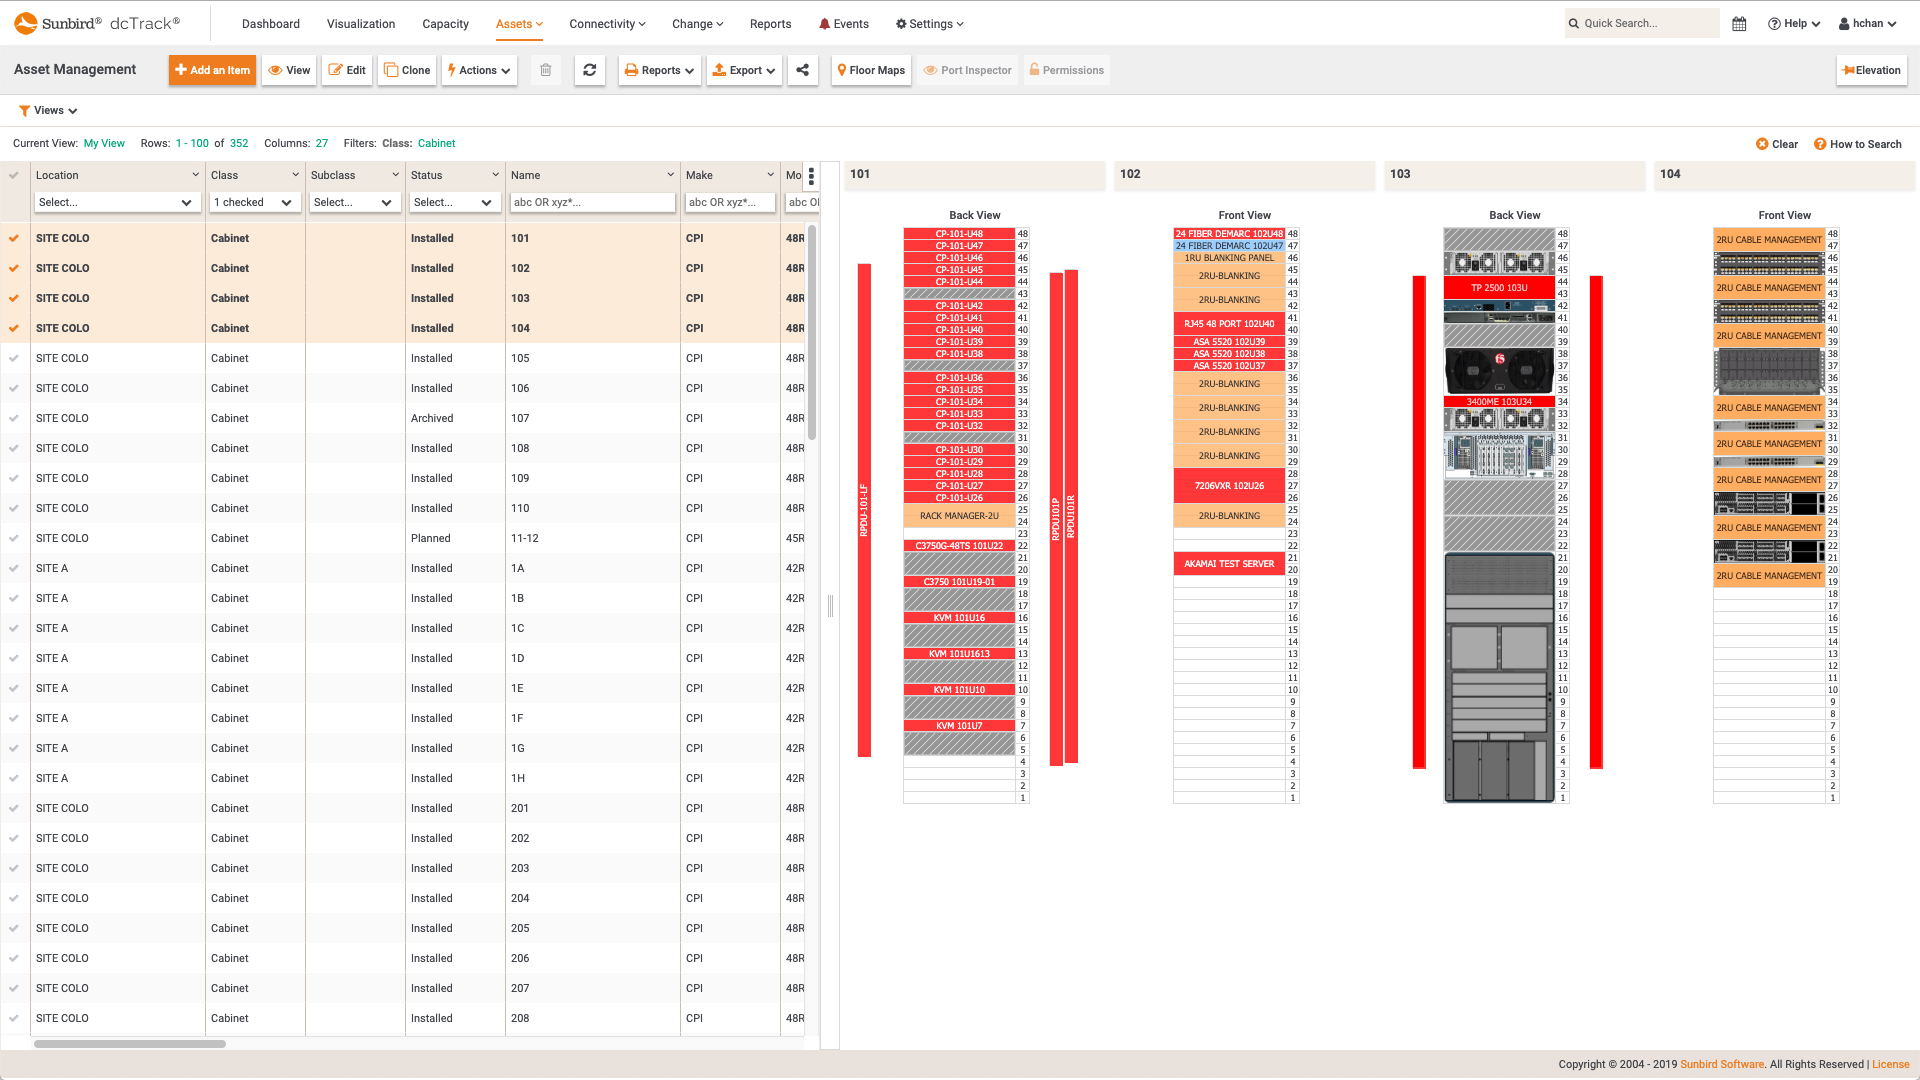
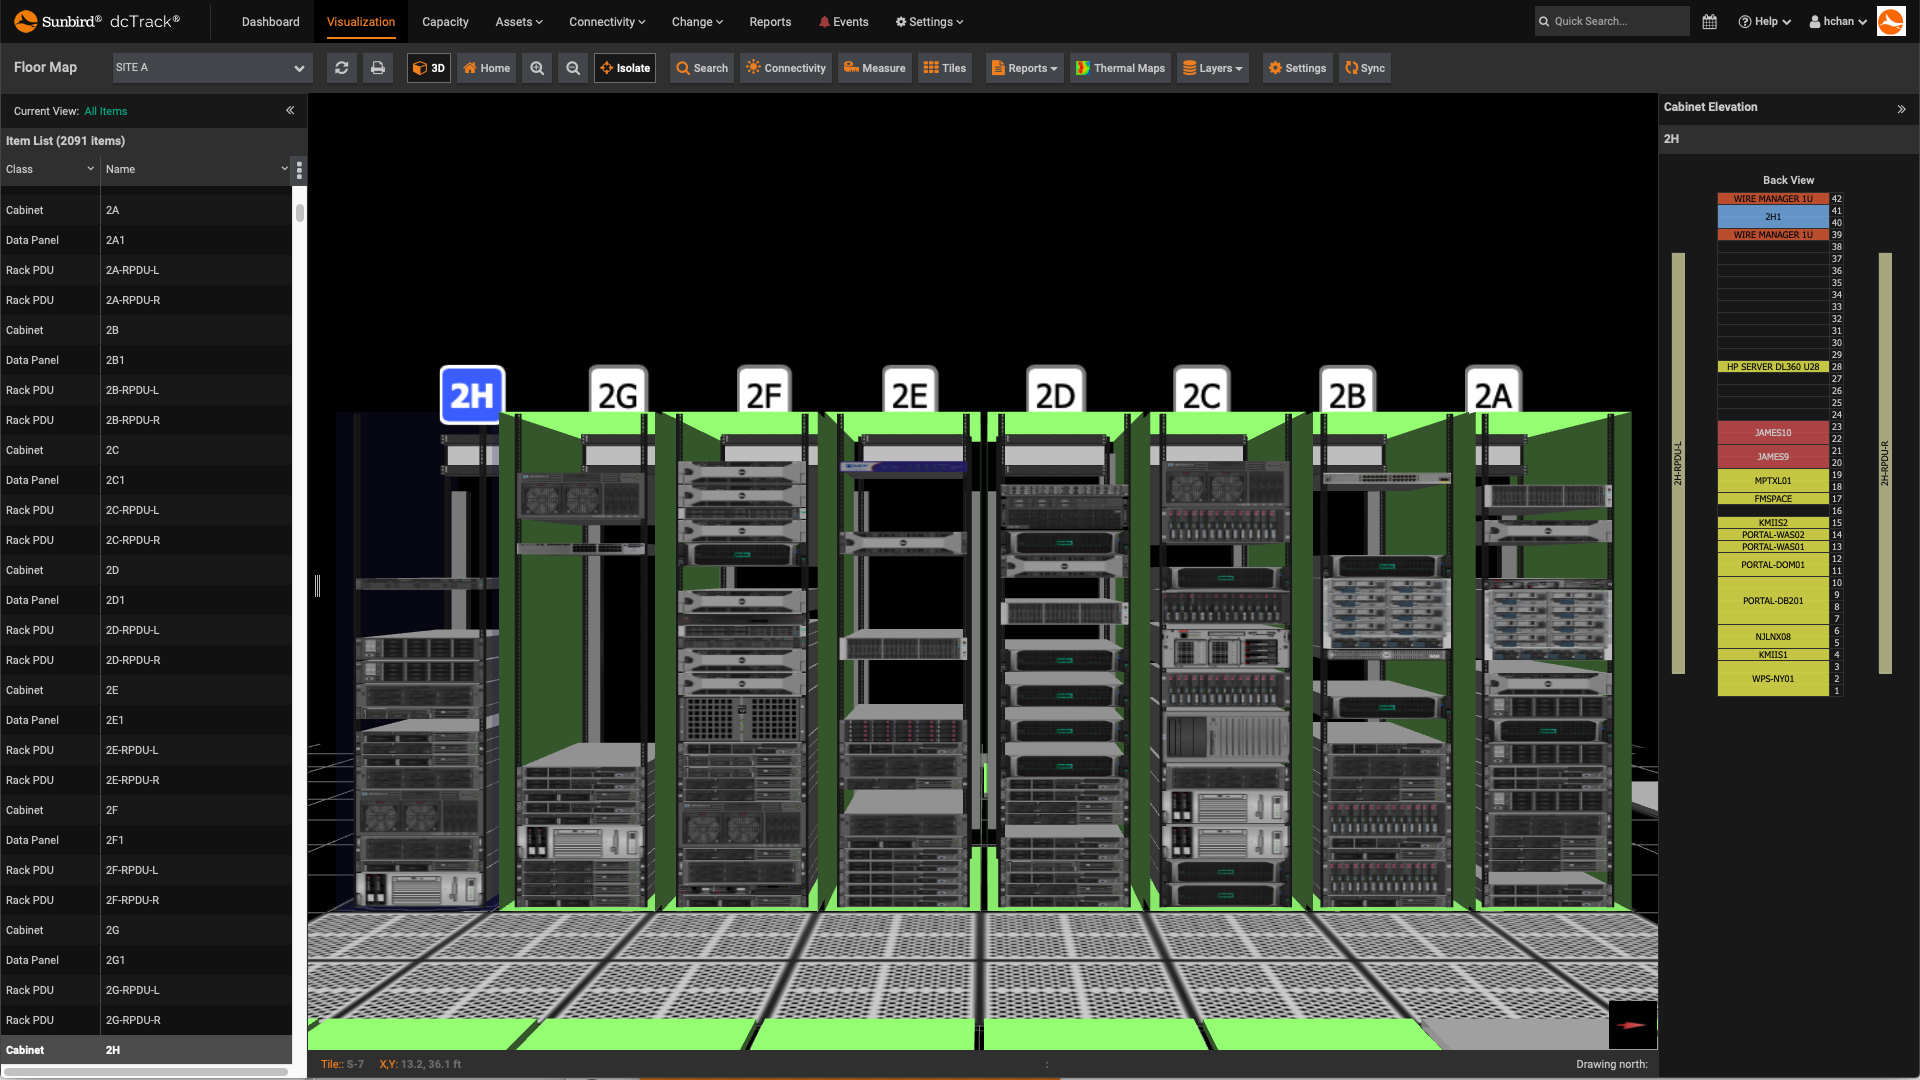
    The Isolate feature allows users to select one or more cabinets to view their contents and other information, such as environmental and power data.

    dcTrack DCIM Operations | Visualization
    Cabinet Elevations
  • Screenshot of Power Dashboard
    Screenshot of Power Dashboard
    Power Dashboard

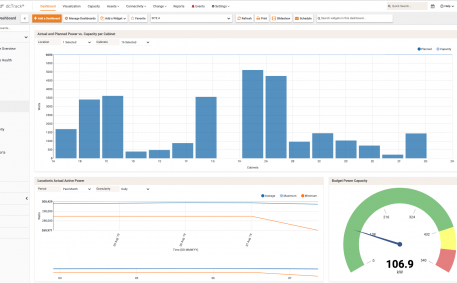
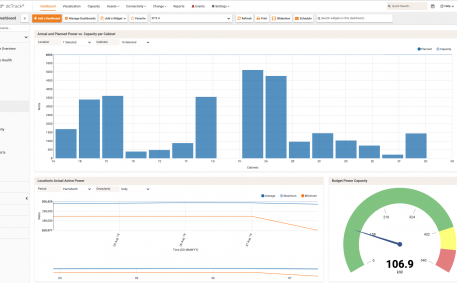
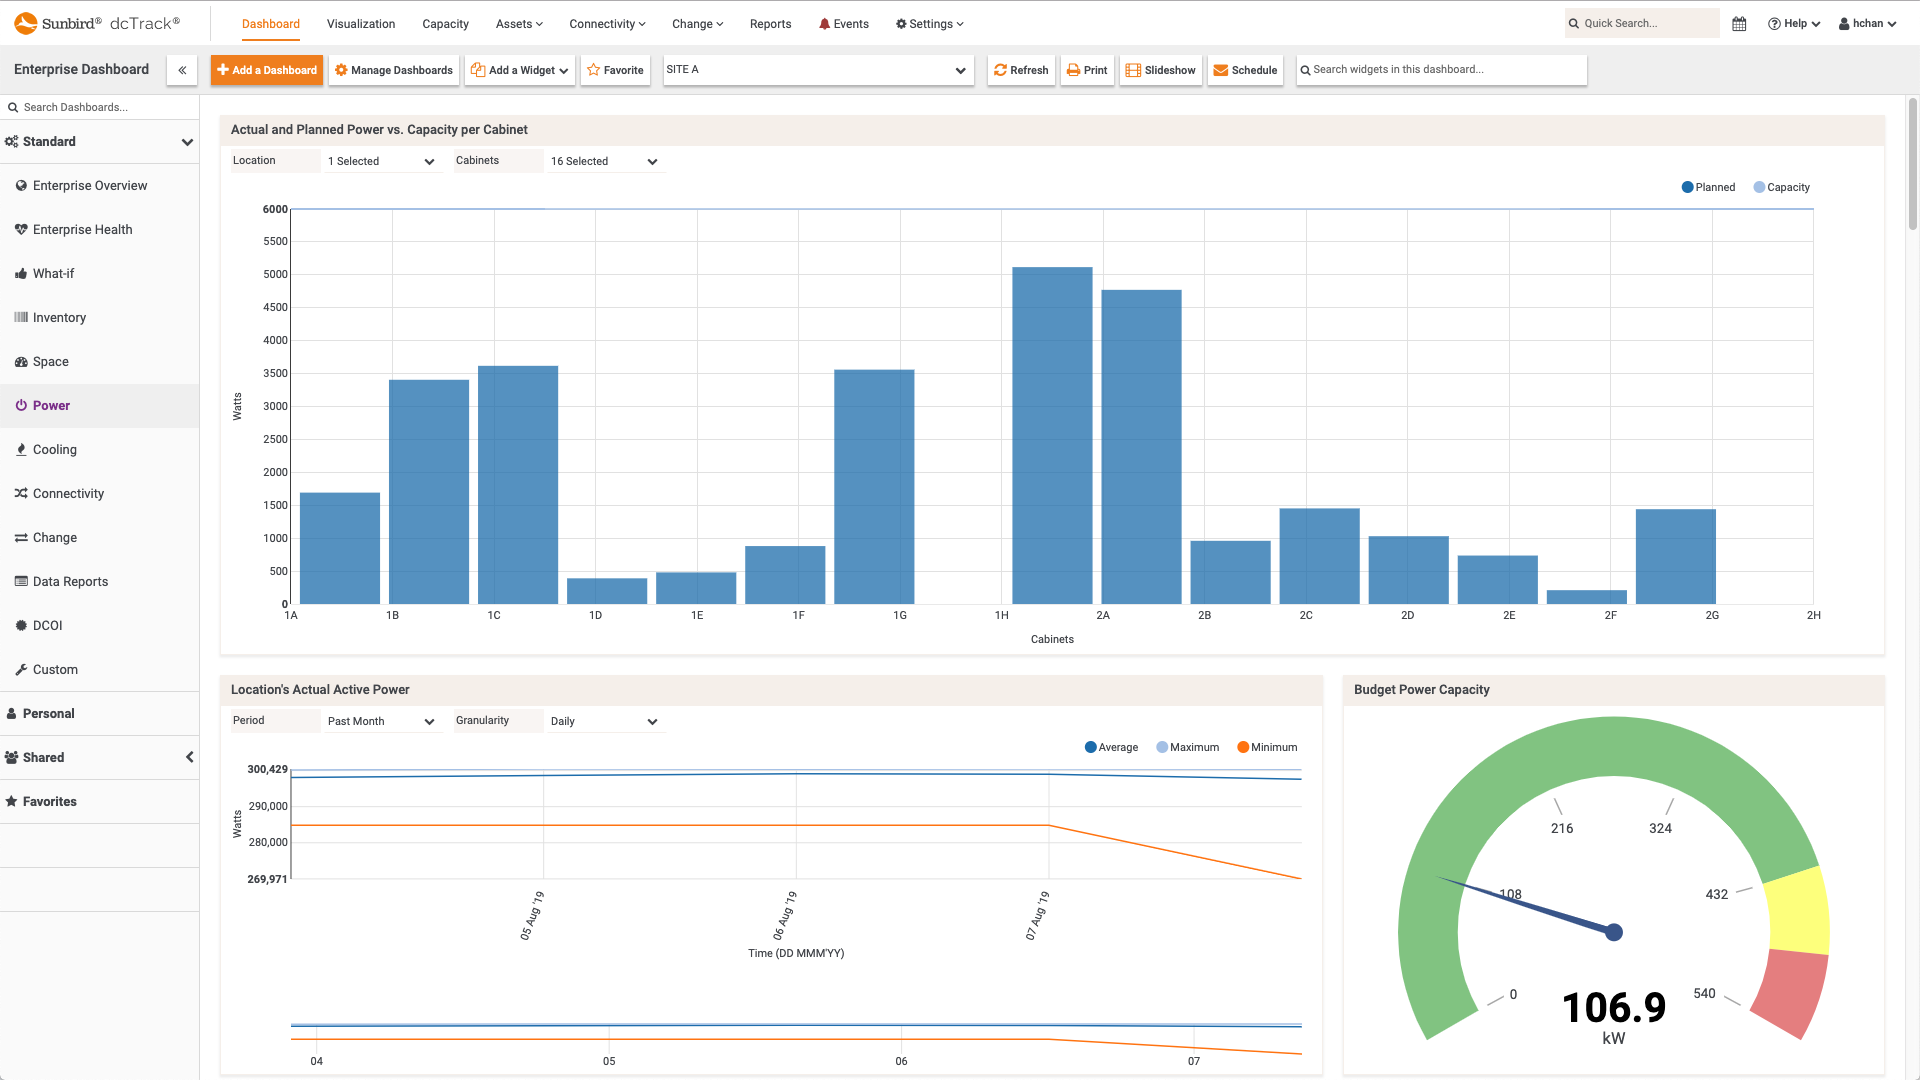
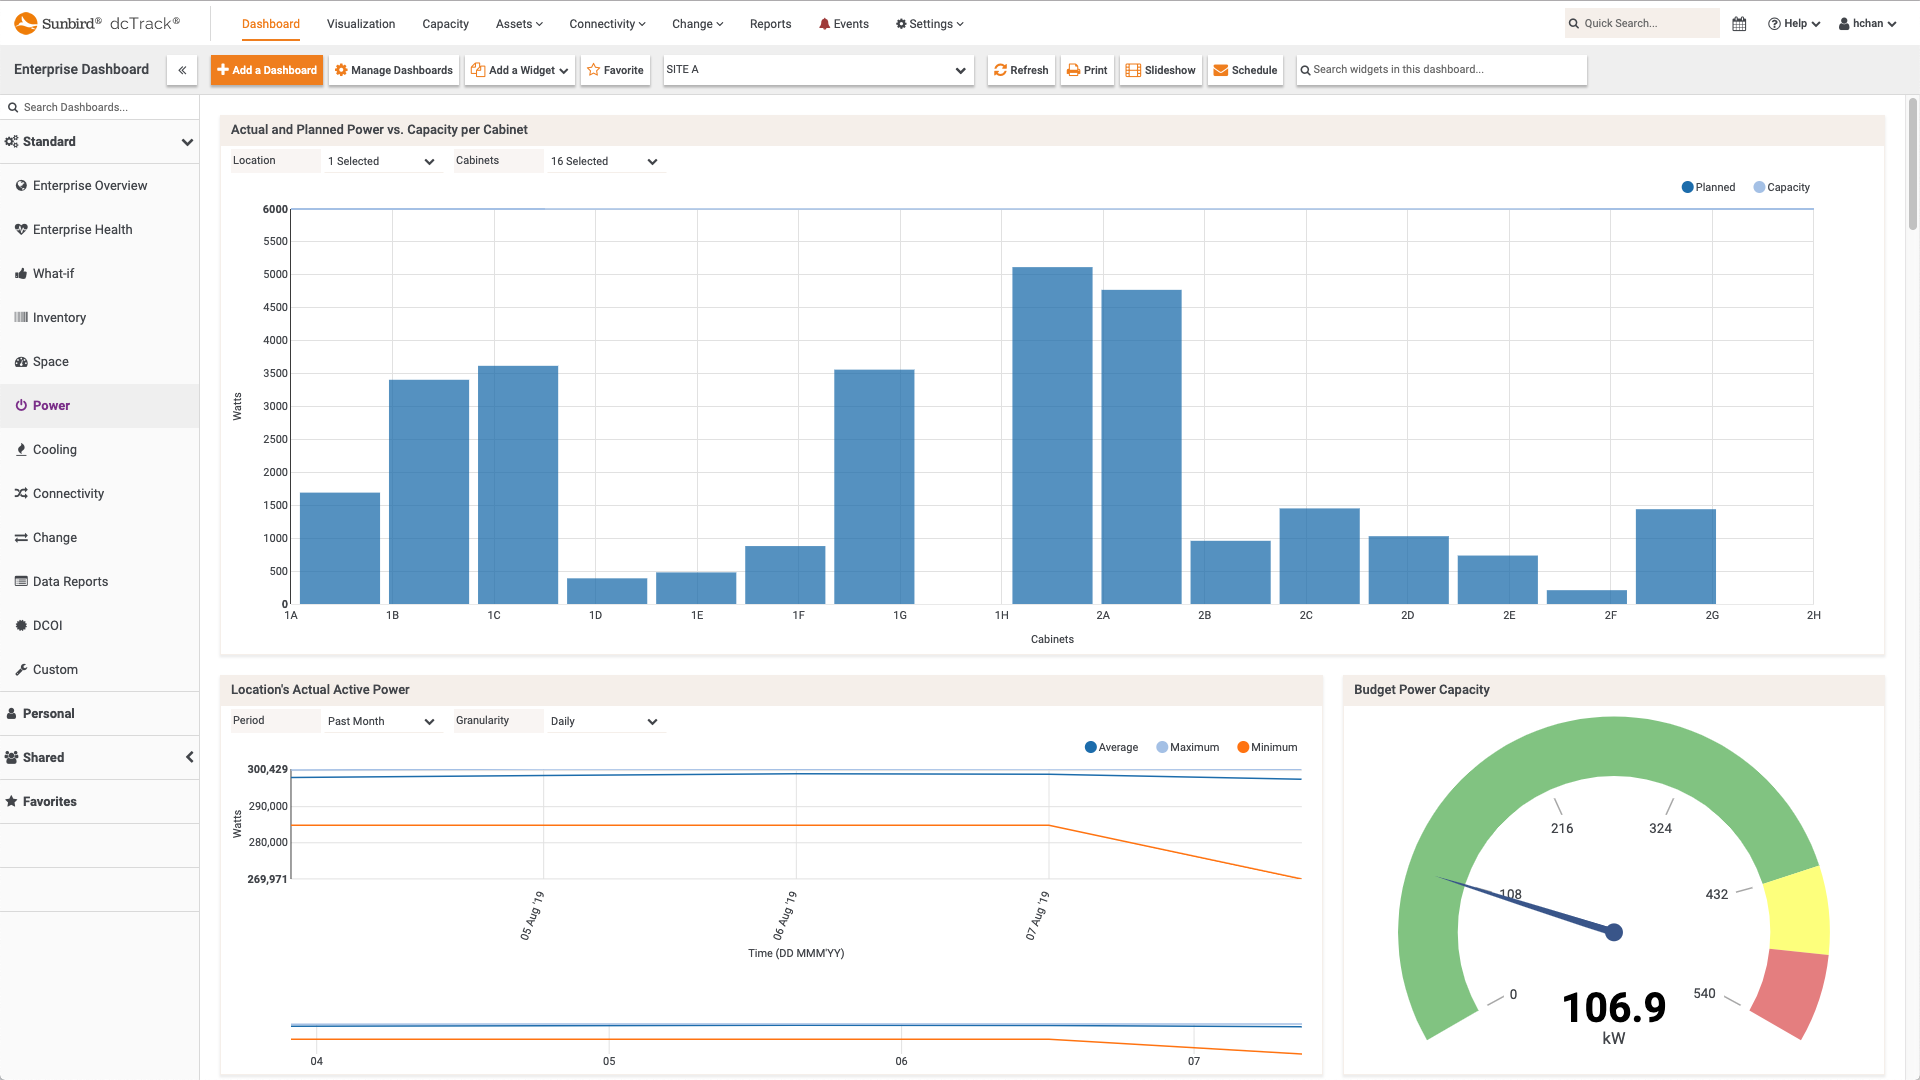
    This sample Power dashboard shows just a few of the metrics that can be tracked, including Actual and Planned Power vs. Capacity per Cabinet, Location's Actual Active Power, and Budget Power Capacity.

    dcTrack DCIM Operations | Power Management | Dashboards | BI & Data Analytics
    Power Dashboard
  • Screenshot of Network Line Card Item Details
    Screenshot of Network Line Card Item Details
    Network Line Card Item Details

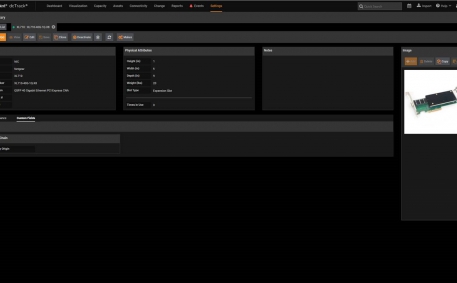
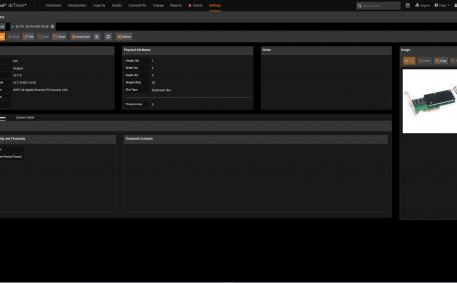
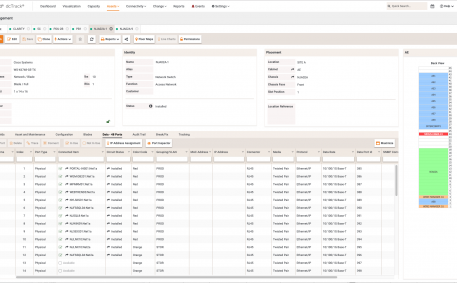
    An Item Details page displays critical information about the item, including make, model, location, custom fields, data ports, and power ports. 

    dcTrack DCIM Operations | Asset Management
    Network Line Card Item Details
  • Screenshot of Multi-Select Cabinet Elevation Views From Any Site and Row
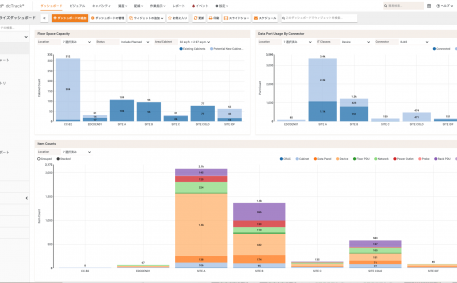
    Screenshot of Multi-Select Cabinet Elevation Views From Any Site and Row
    Multi-Select Cabinet Elevation Views From Any Site and Row

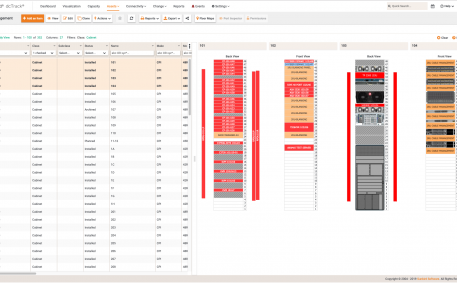
    Visualize contents of multiple racks across any site to view real-time capacity. View granular, detailed information on individual assets with a single click.

    dcTrack DCIM Operations | Asset Management | Visualization
    Multi-Select Cabinet Elevation Views From Any Site and Row
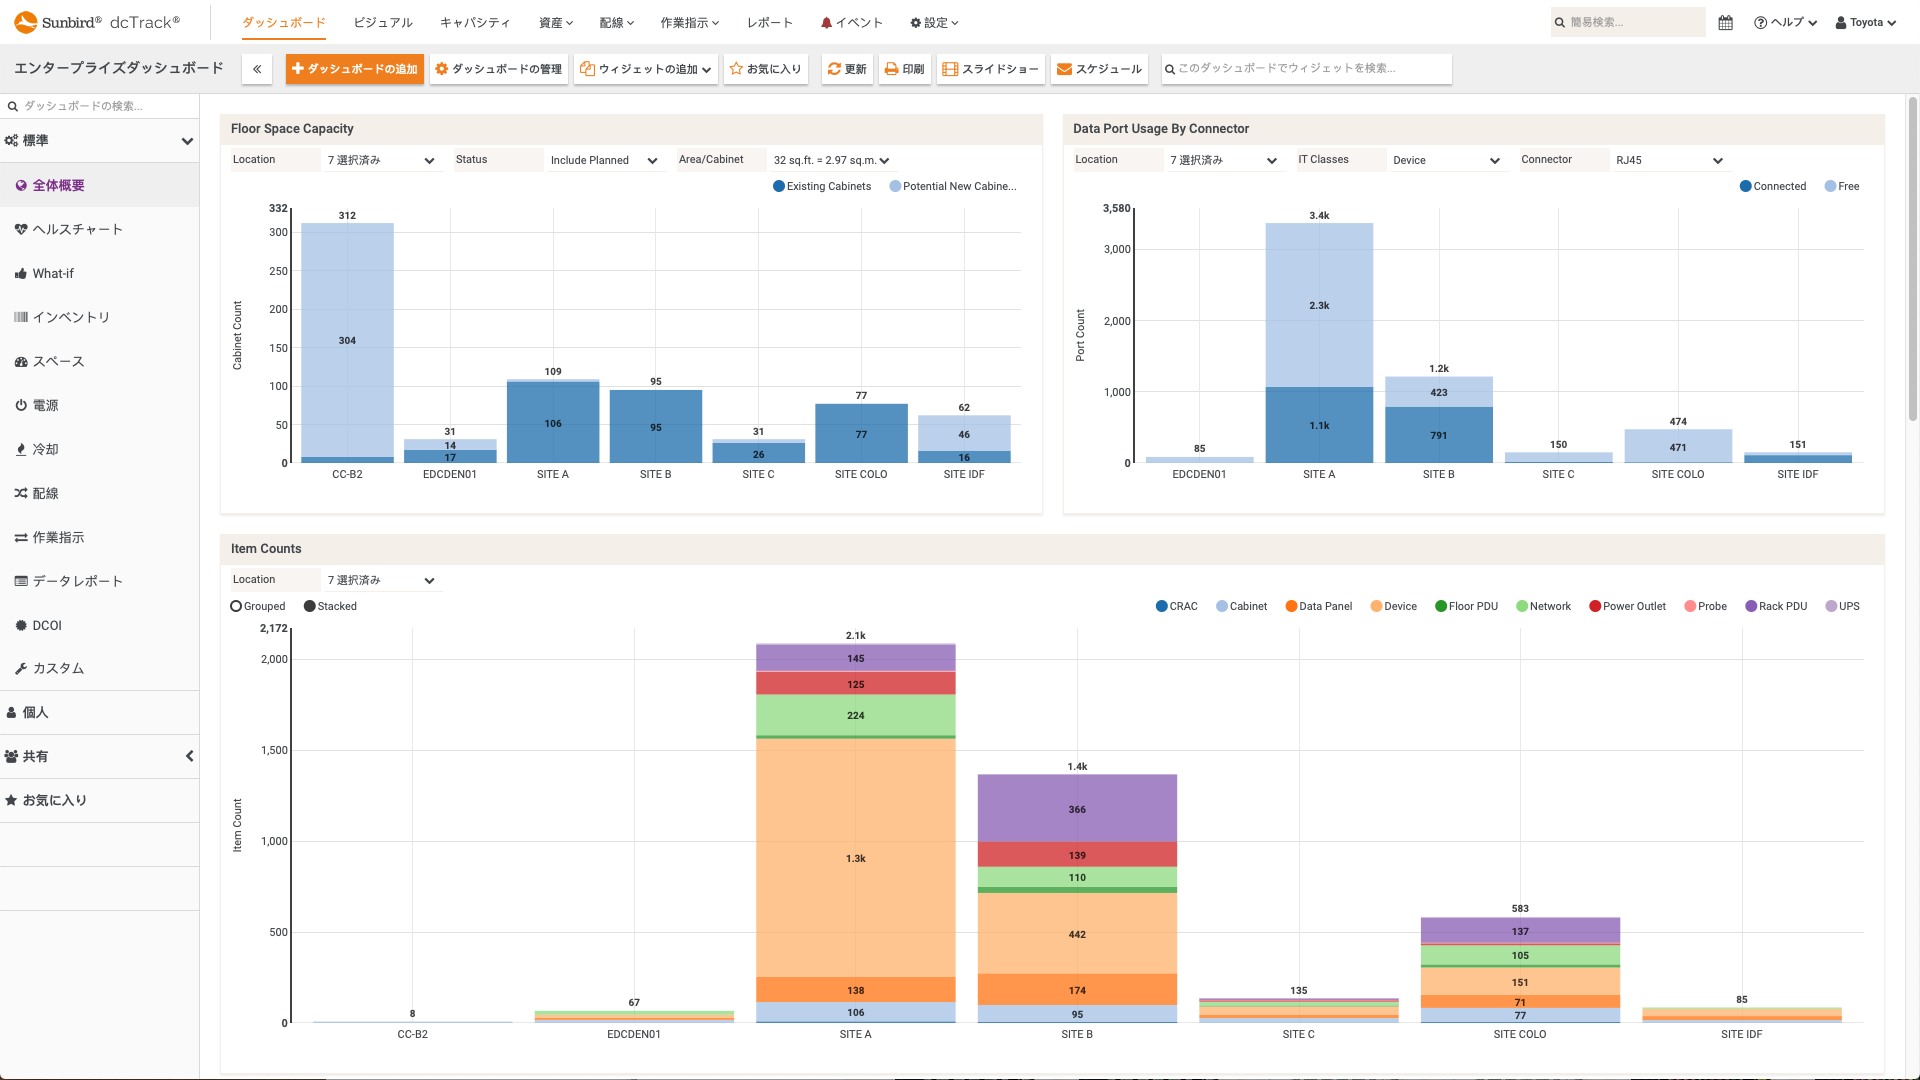
  • Screenshot of GUI Localization - Japanese
    Screenshot of GUI Localization - Japanese
    GUI Localization - Japanese

    dcTrack supports English, Simplified Chinese, French, German, and Japanese.

    dcTrack DCIM Operations
    GUI Localization - Japanese
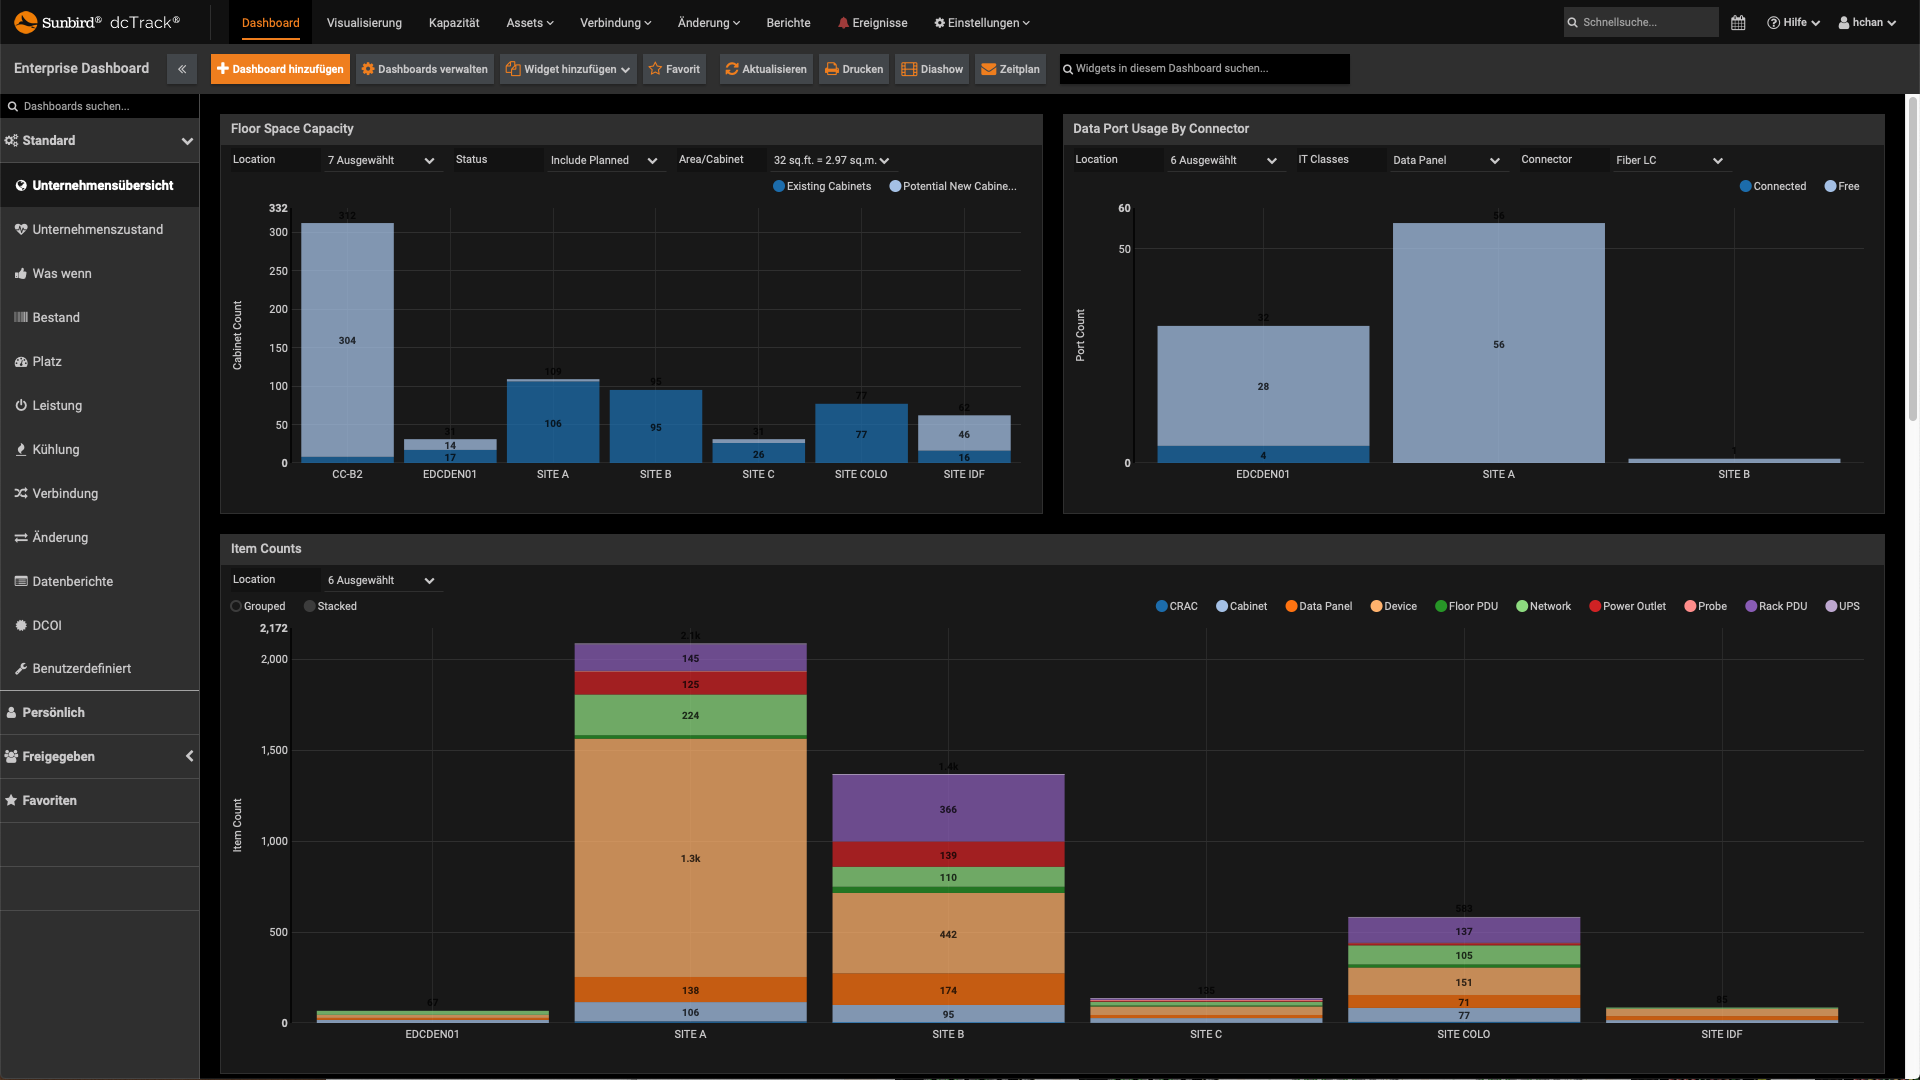
  • Screenshot of GUI Localization - German
    Screenshot of GUI Localization - German
    GUI Localization - German

    dcTrack supports English, Simplified Chinese, French, German, and Japanese.

    dcTrack DCIM Operations
    GUI Localization - German
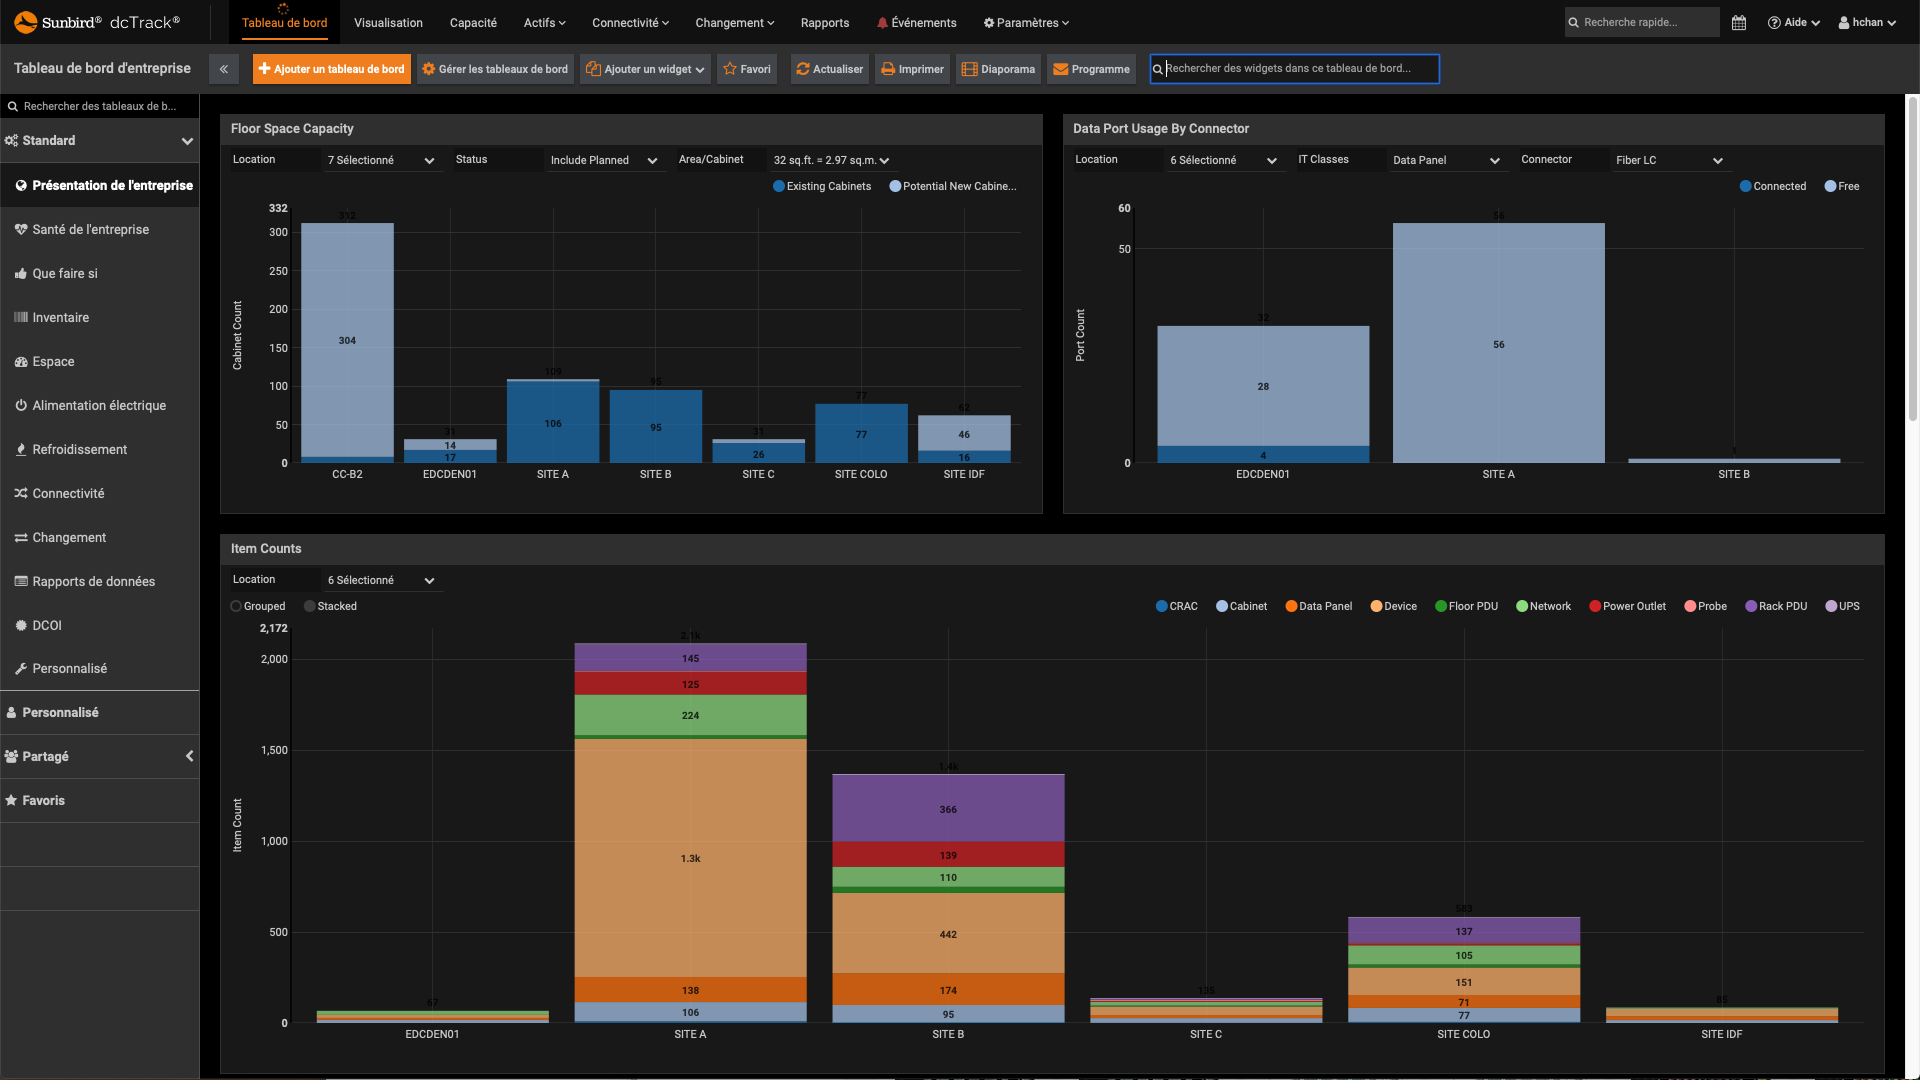
  • Screenshot of GUI Localization - French
    Screenshot of GUI Localization - French
    GUI Localization - French

    dcTrack supports English, Simplified Chinese, French, German, and Japanese.

    dcTrack DCIM Operations
    GUI Localization - French
  • Screenshot of GUI Localization - Chinese
    Screenshot of GUI Localization - Chinese
    GUI Localization - Chinese

    dcTrack supports English, Simplified Chinese, French, German, and Japanese.

    dcTrack DCIM Operations
    GUI Localization - Chinese
  • Screenshot of Granular Permissions per Inventory Item
    Screenshot of Granular Permissions per Inventory Item
    Granular Permissions per Inventory Item

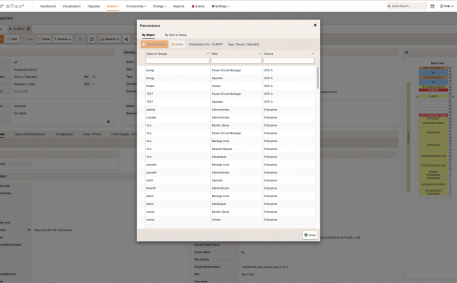
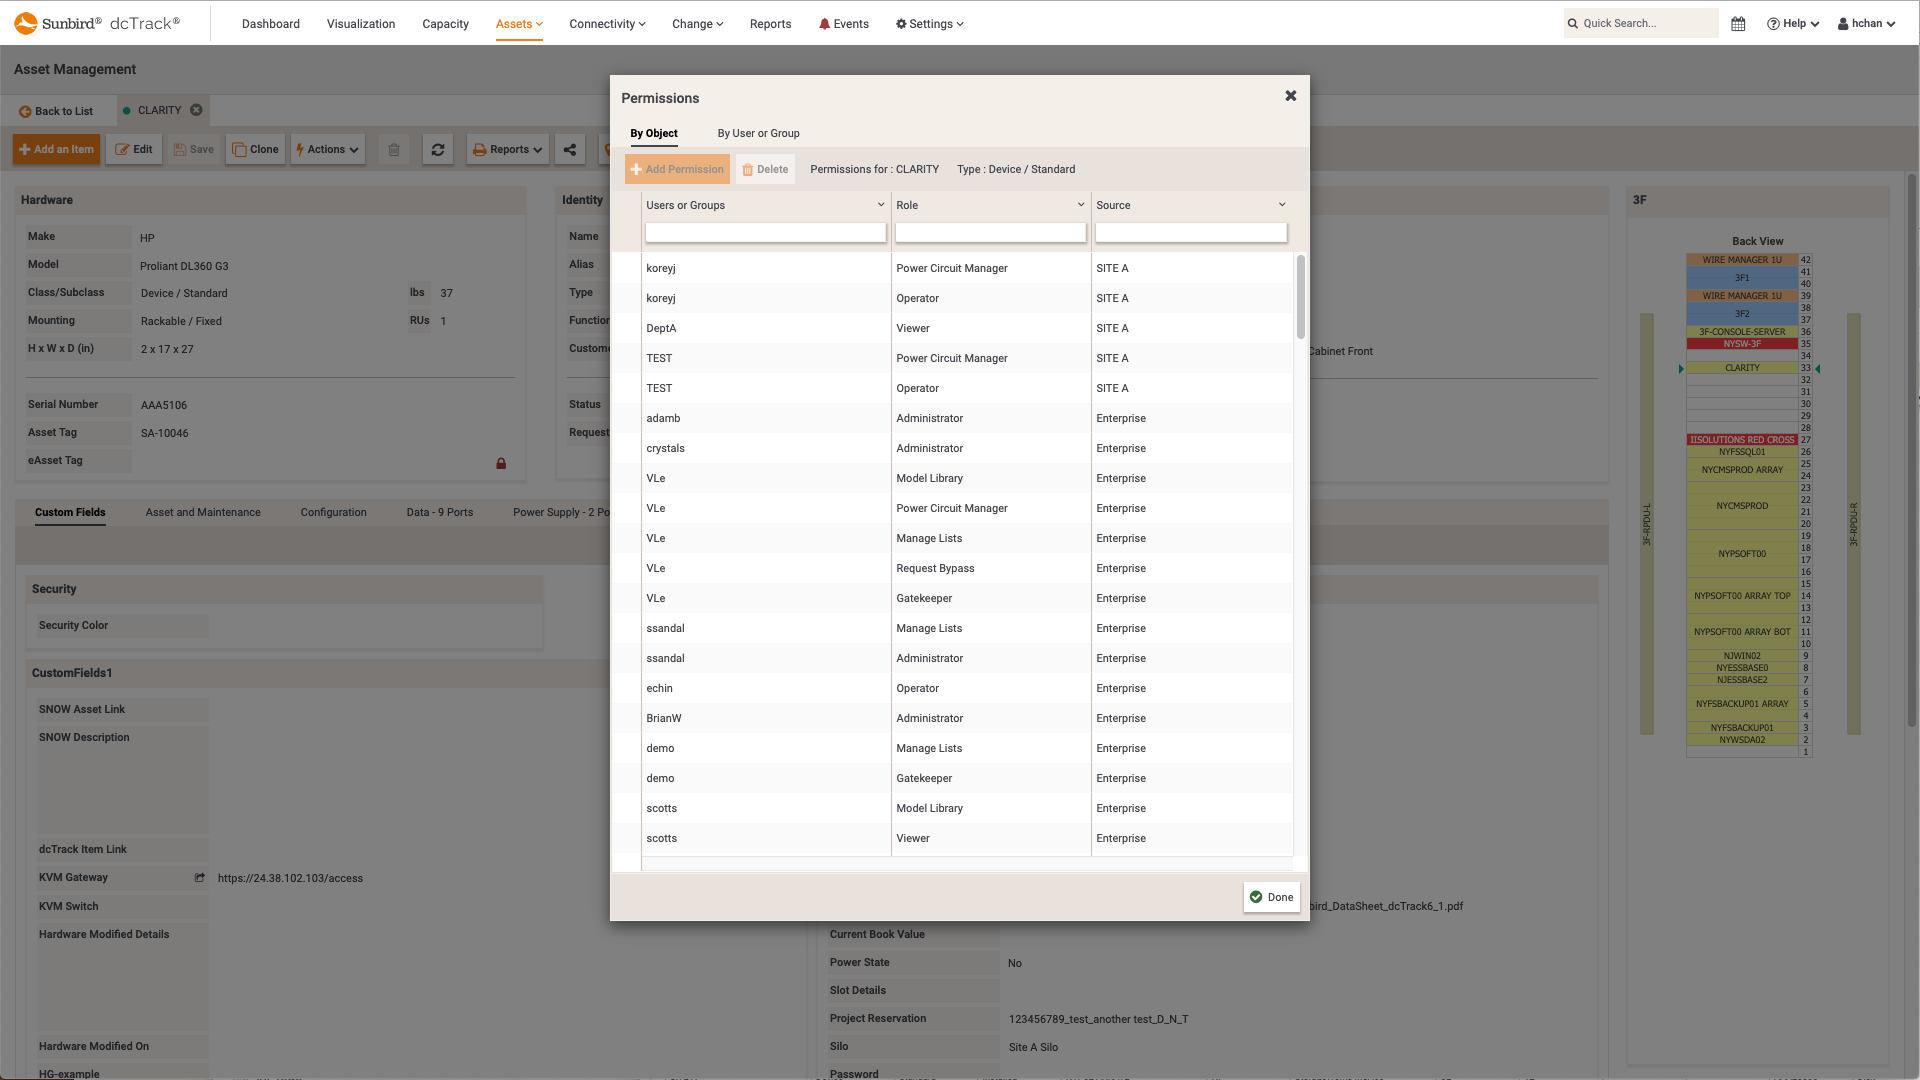
    Set permissions by object, user, or group.

    dcTrack DCIM Operations | Asset Management
    Granular Permissions per Inventory Item
  • Screenshot of Filtered 3D Search of All Server Models
    Screenshot of Filtered 3D Search of All Server Models
    Filtered 3D Search of All Server Models

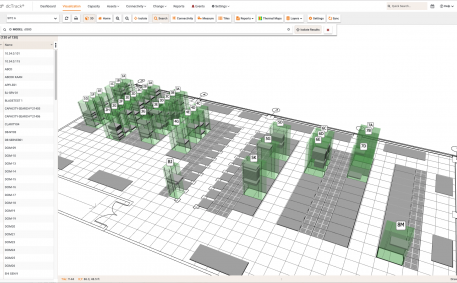
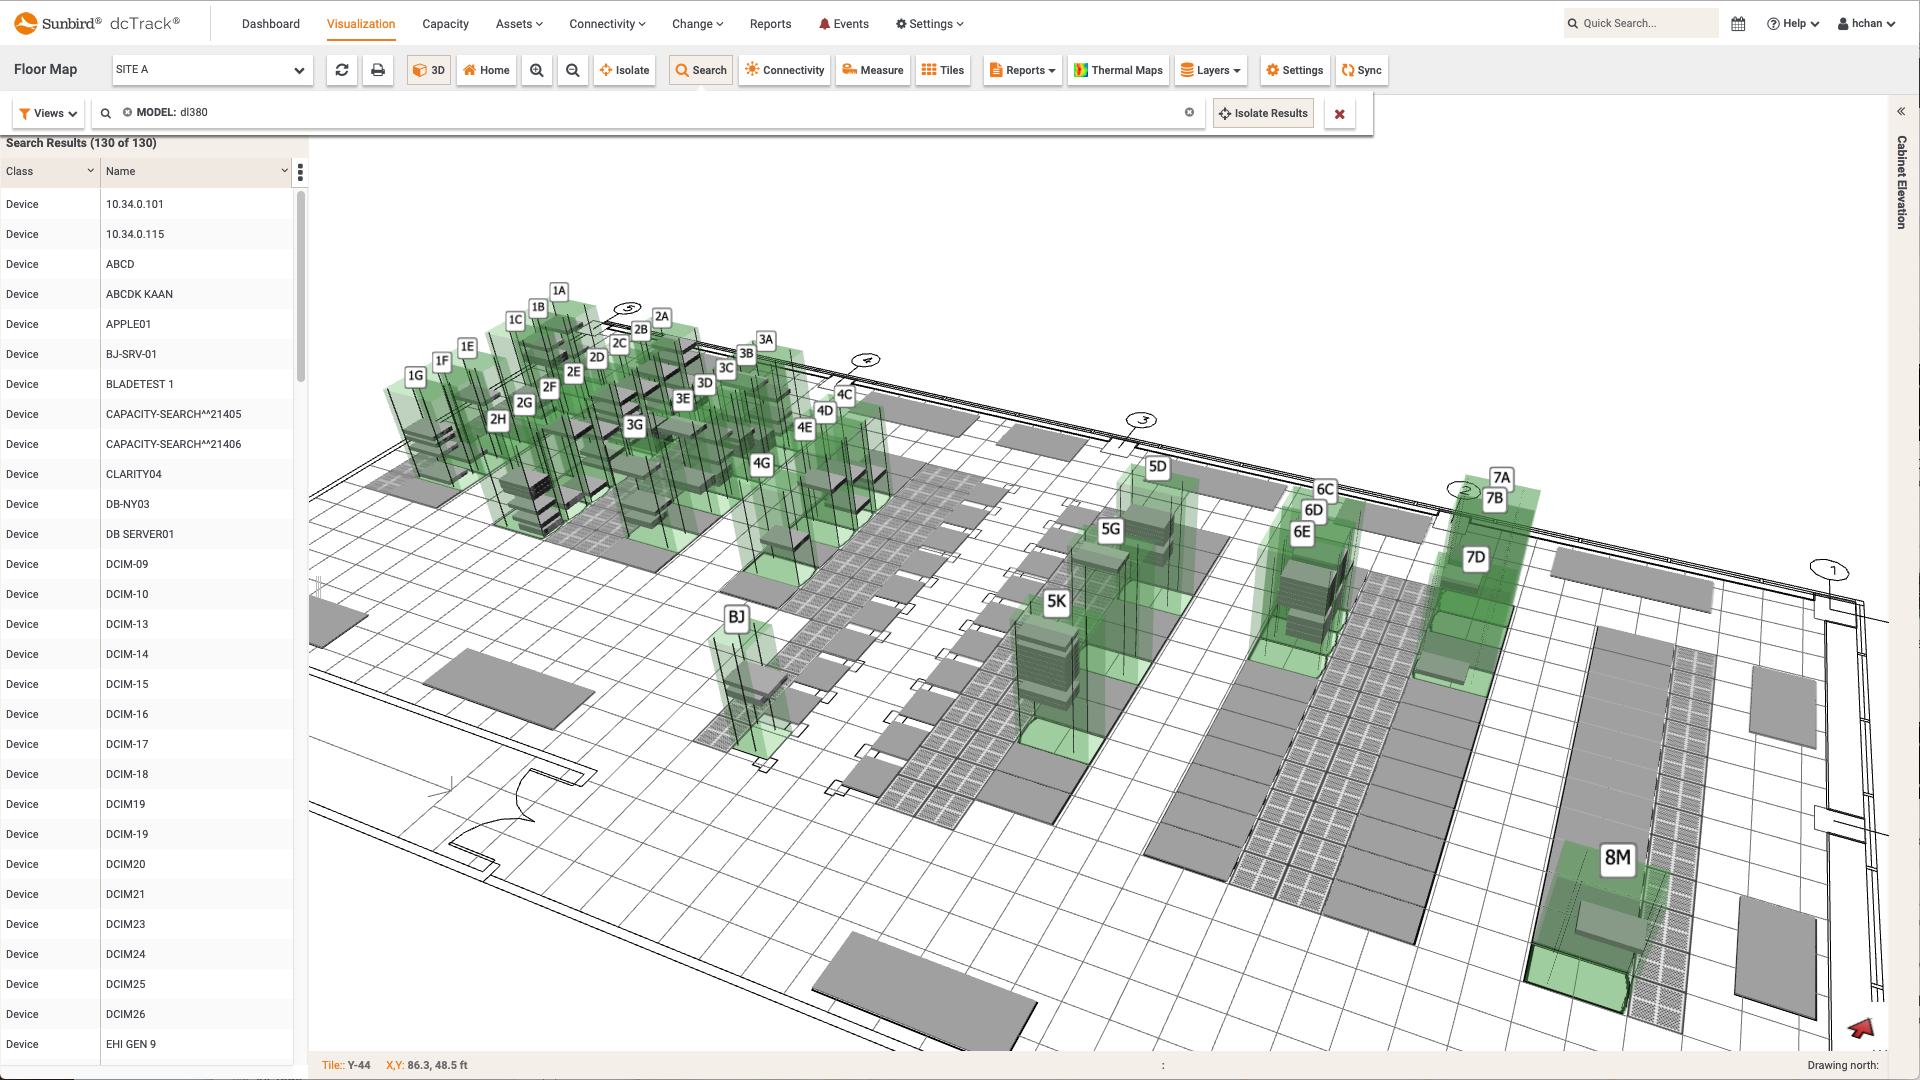
    The floor map can be searched for assets, and the results are displayed visually by isolating the cabinets where the asset is located.

    dcTrack DCIM Operations | Asset Management | Visualization
    Filtered 3D Search of All Server Models
  • Screenshot of Filter, View, and Edit Requests and Work Orders
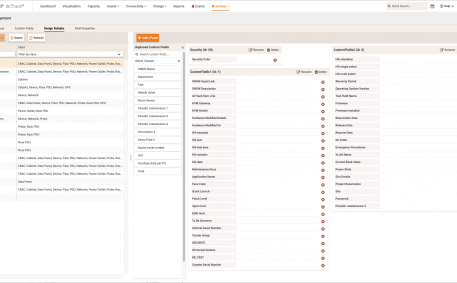
    Screenshot of Filter, View, and Edit Requests and Work Orders
    Filter, View, and Edit Requests and Work Orders

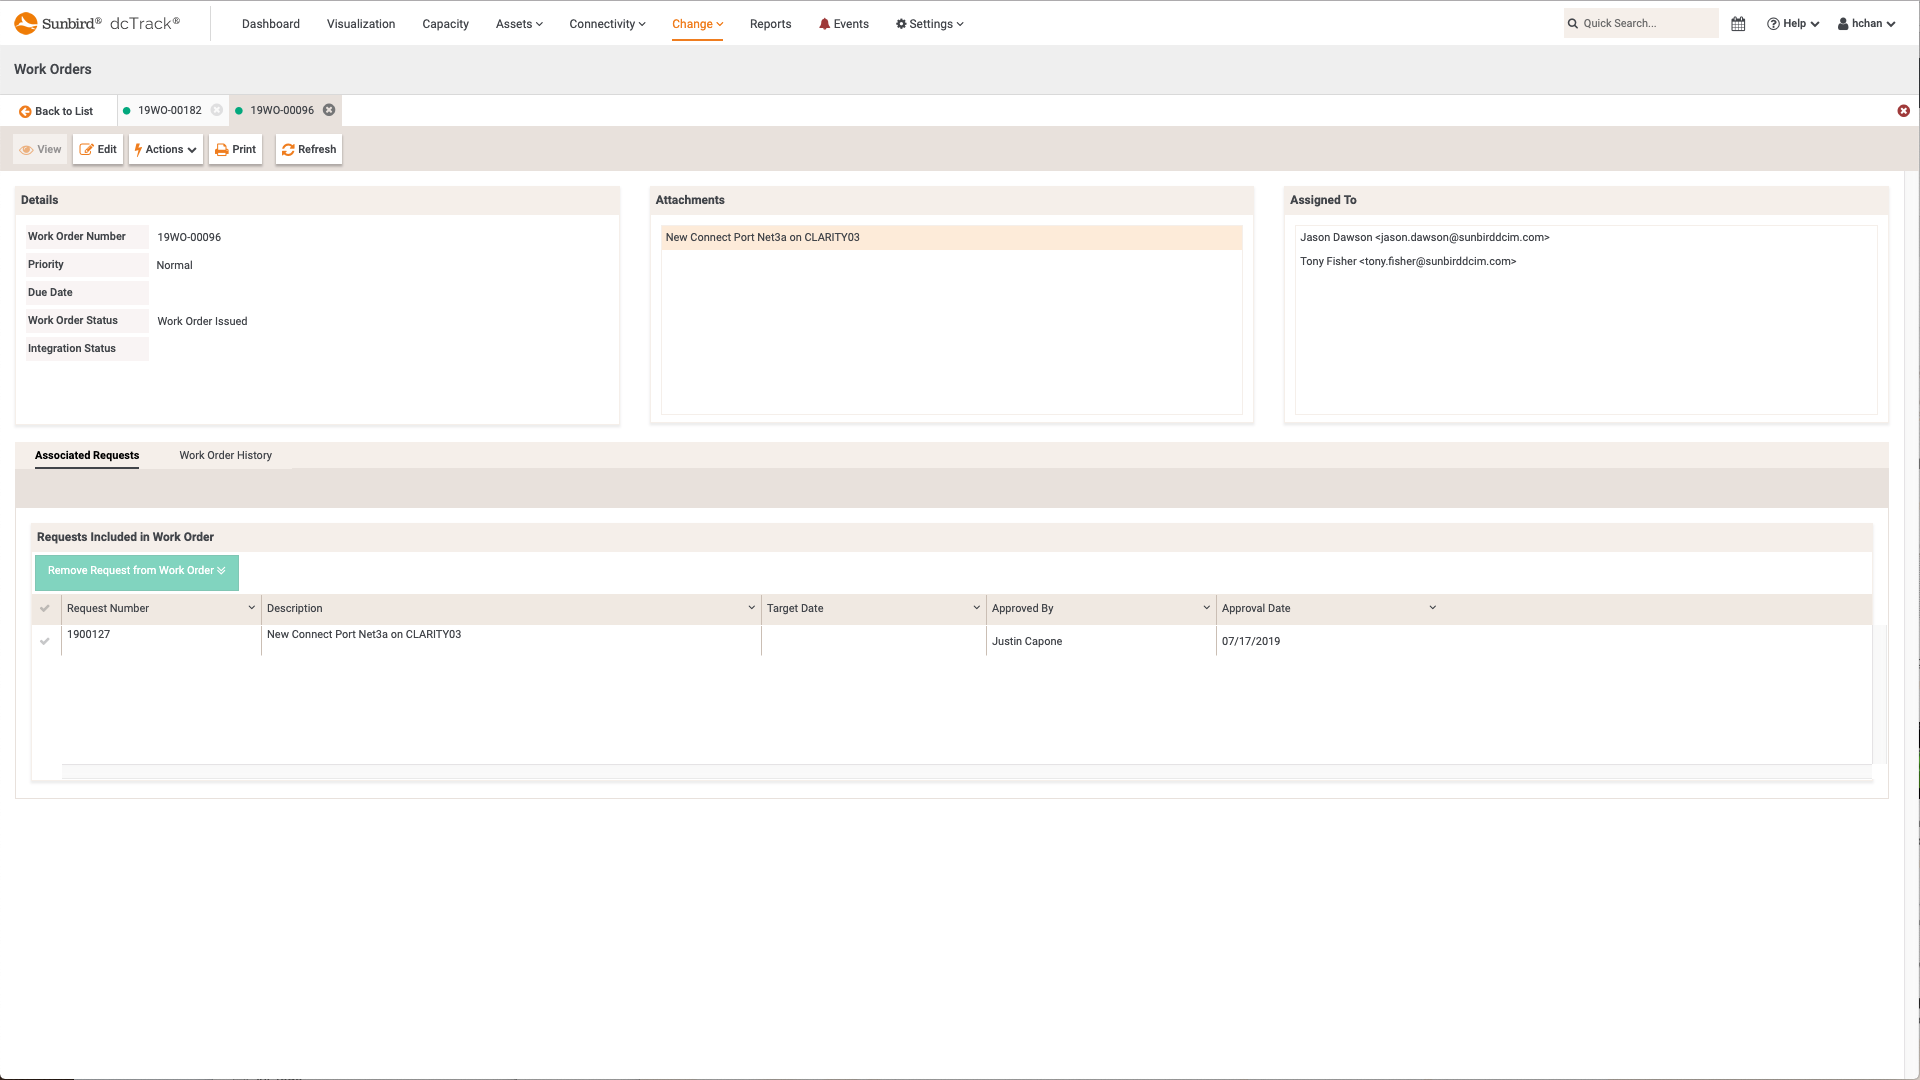
    Filter, view, and edit change requests and work orders with Sunbird's change management functionality.

    dcTrack DCIM Operations | Change Management
    Filter, View, and Edit Requests and Work Orders
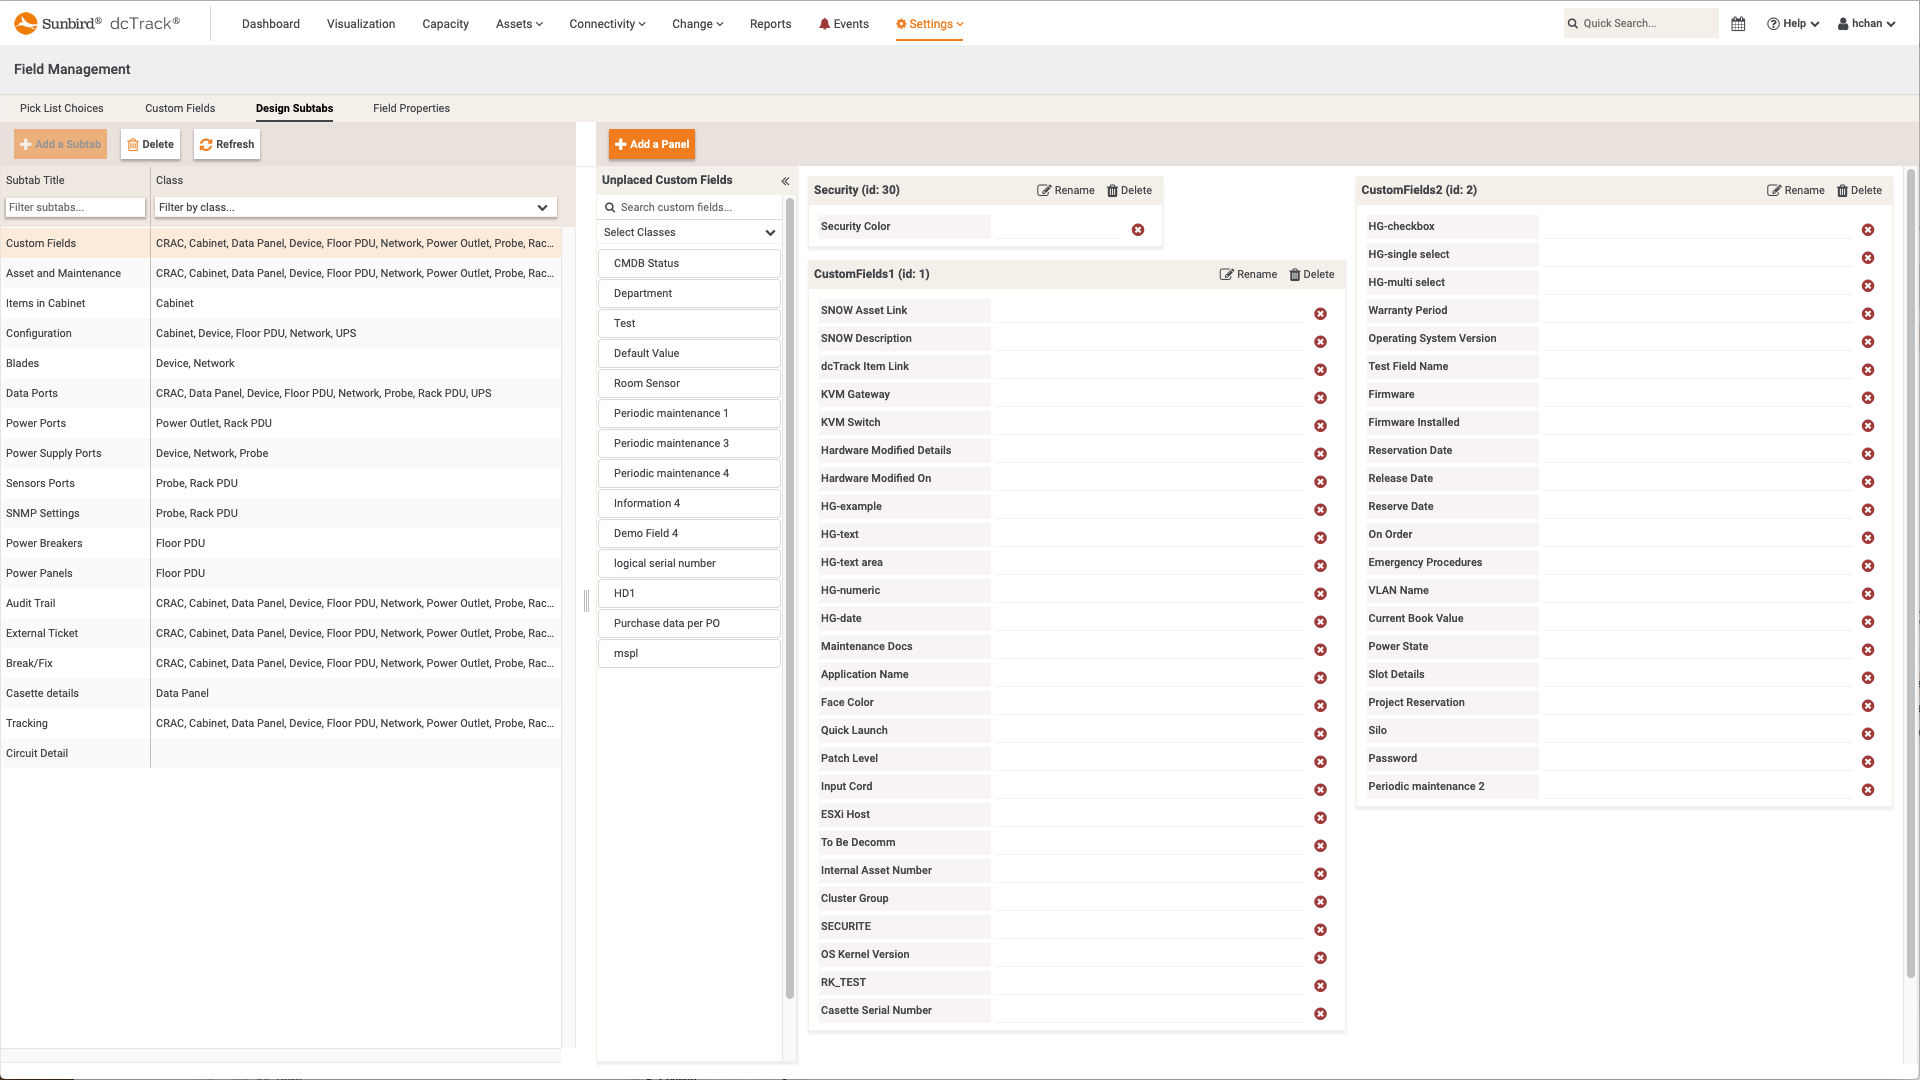
  • Screenshot of Custom Fields, Pick List Choices, Tabs, and Panels
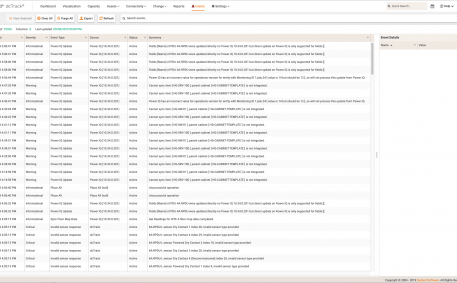
    Screenshot of Custom Fields, Pick List Choices, Tabs, and Panels
    Custom Fields, Pick List Choices, Tabs, and Panels

    Track anything and everything in your data center with Sunbird's custom fields.

    dcTrack DCIM Operations
    Custom Fields, Pick List Choices, Tabs, and Panels
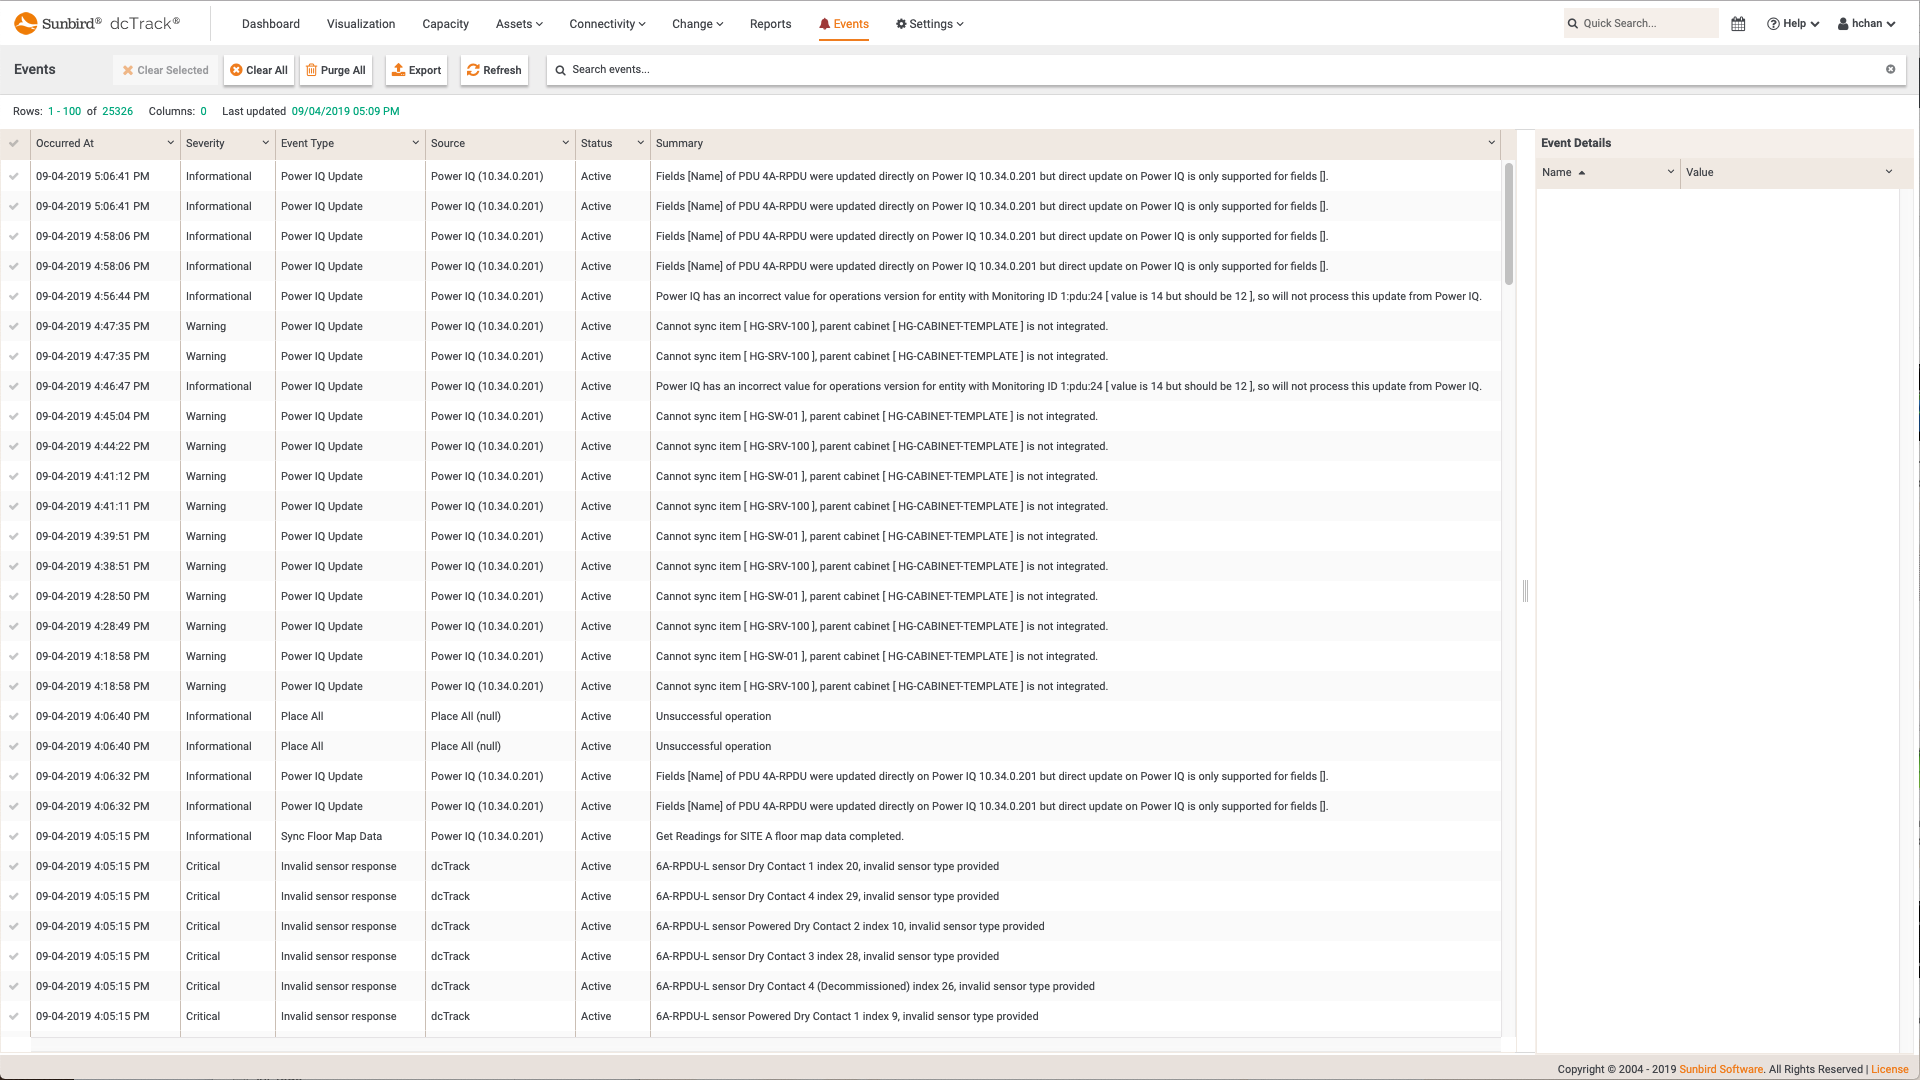
  • Screenshot of Consolidated Event Management Tab
    Screenshot of Consolidated Event Management Tab
    Consolidated Event Management Tab

    View all events with information on Severity, Type, Source, and more.

    dcTrack DCIM Operations
    Consolidated Event Management Tab
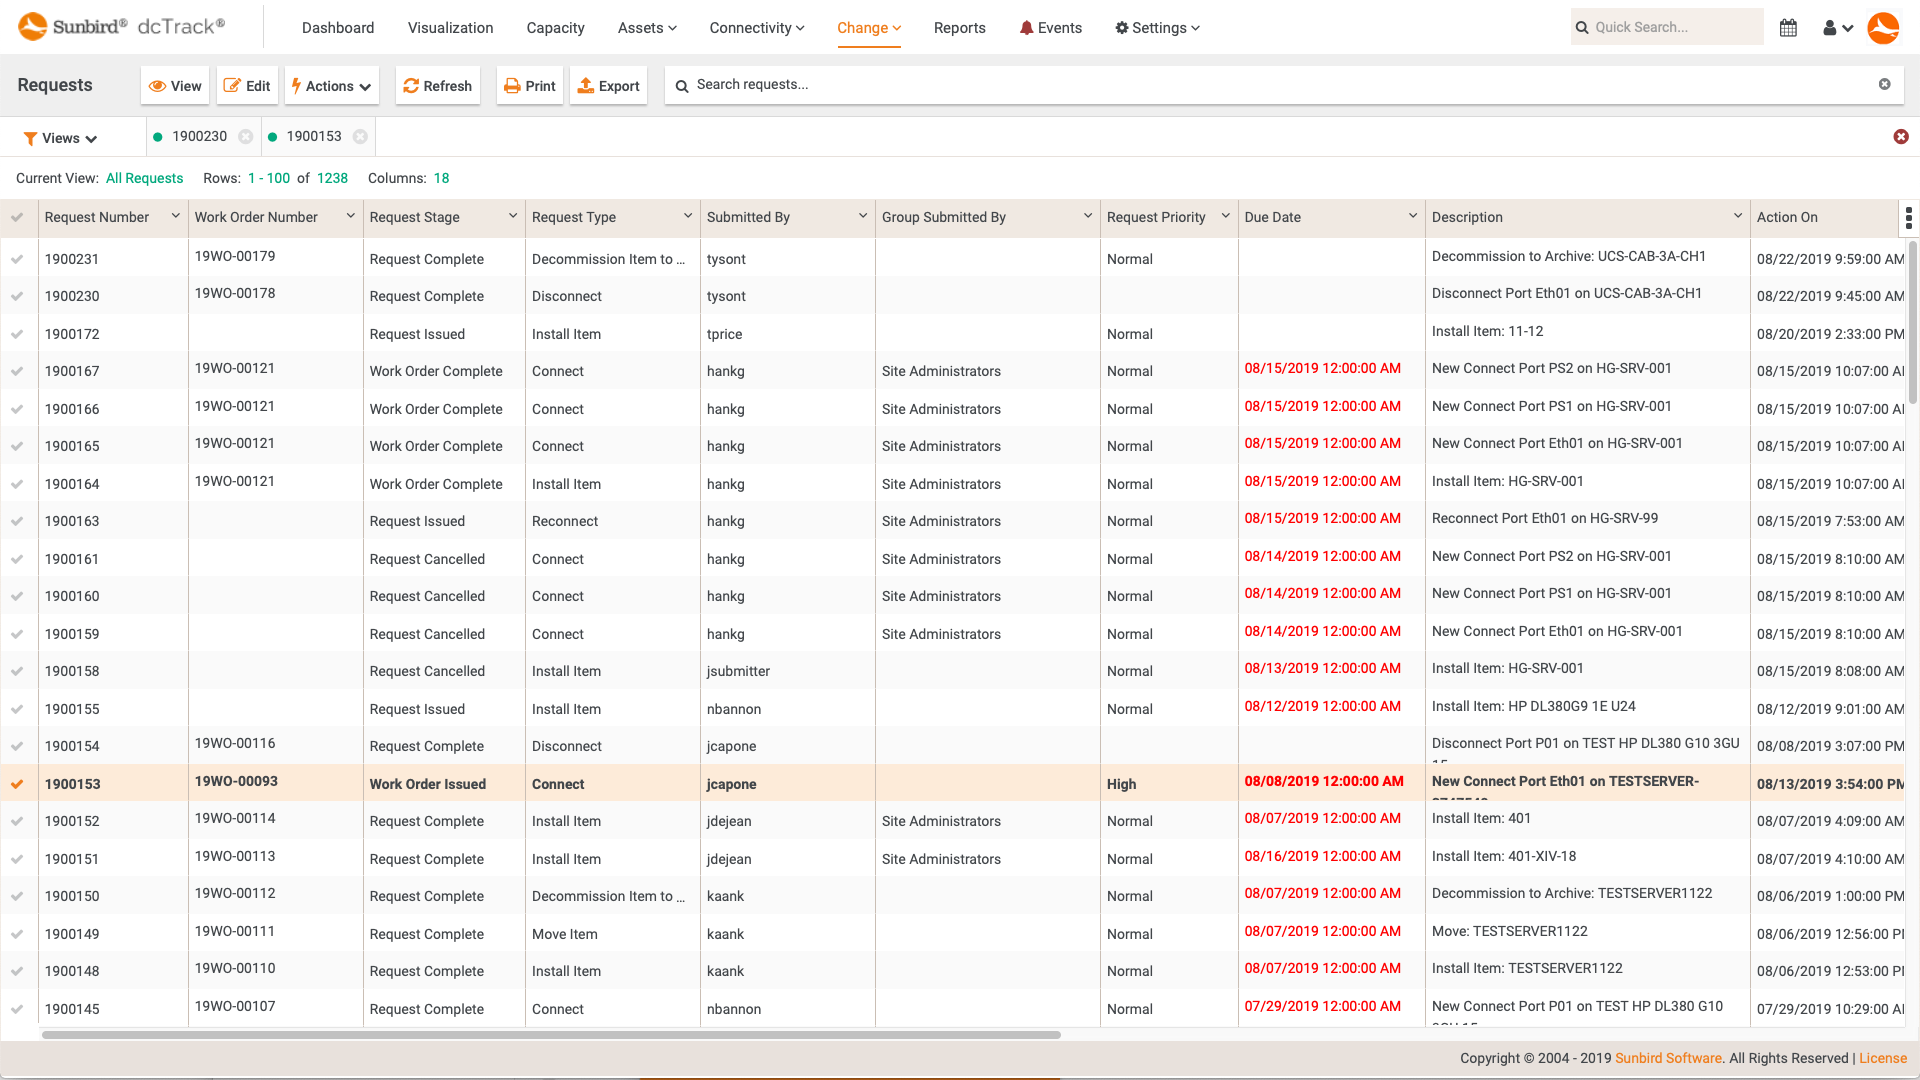
  • Screenshot of Change Requests
    Screenshot of Change Requests
    Change Requests

    View all change requests with information on Request Stage, Type, Priority, and more.

    dcTrack DCIM Operations | Change Management
    Change Requests
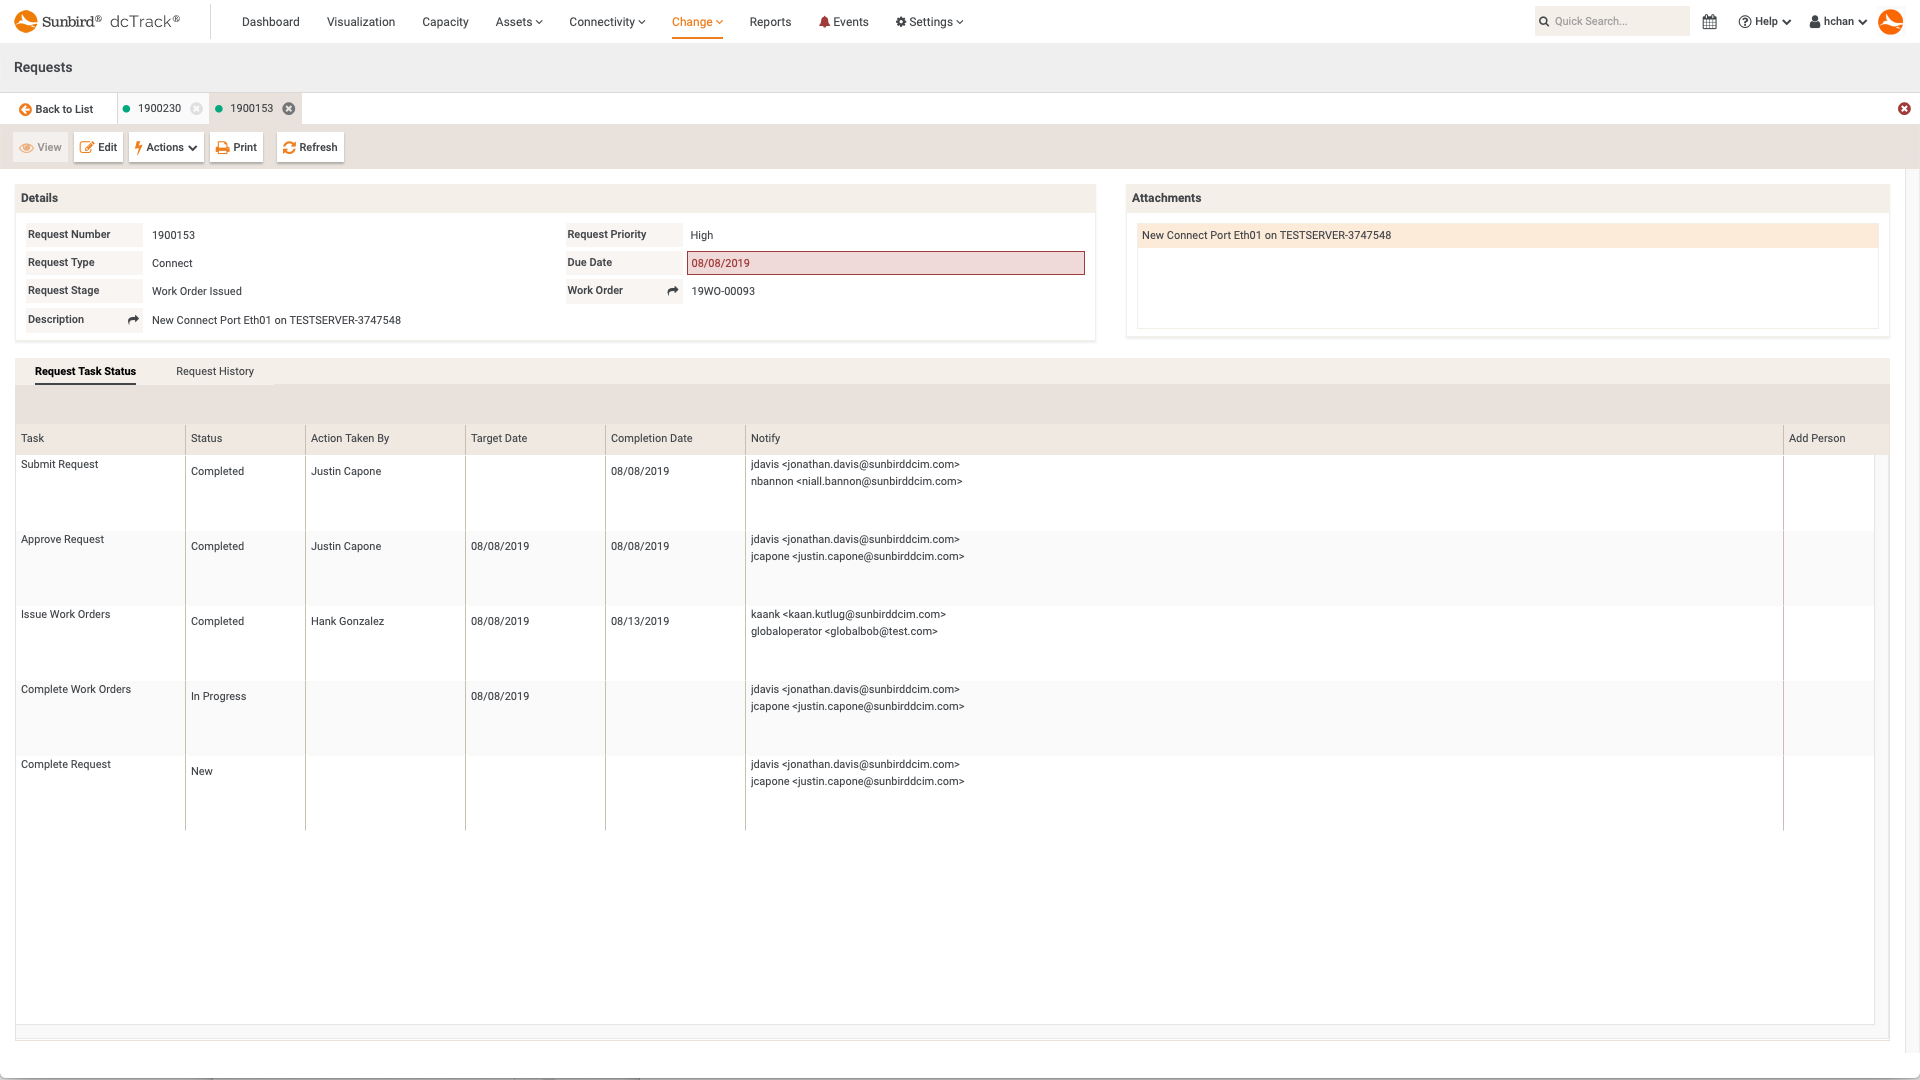
  • Screenshot of Change Request Details
    Screenshot of Change Request Details
    Change Request Details

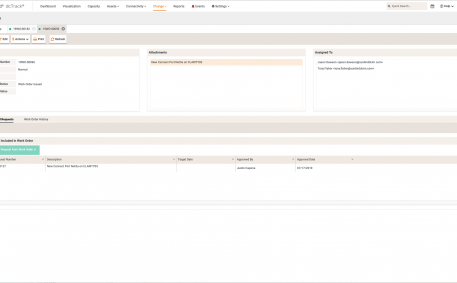
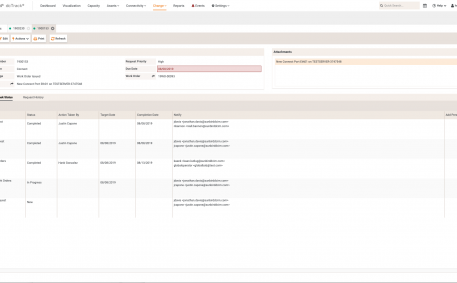
    The change request details show the status of each task from Submit Request to Complete Request.

    dcTrack DCIM Operations | Change Management
    Change Request Details
  • Screenshot of 3D View - What's Connected to What
    Screenshot of 3D View - What's Connected to What
    3D View - What's Connected to What

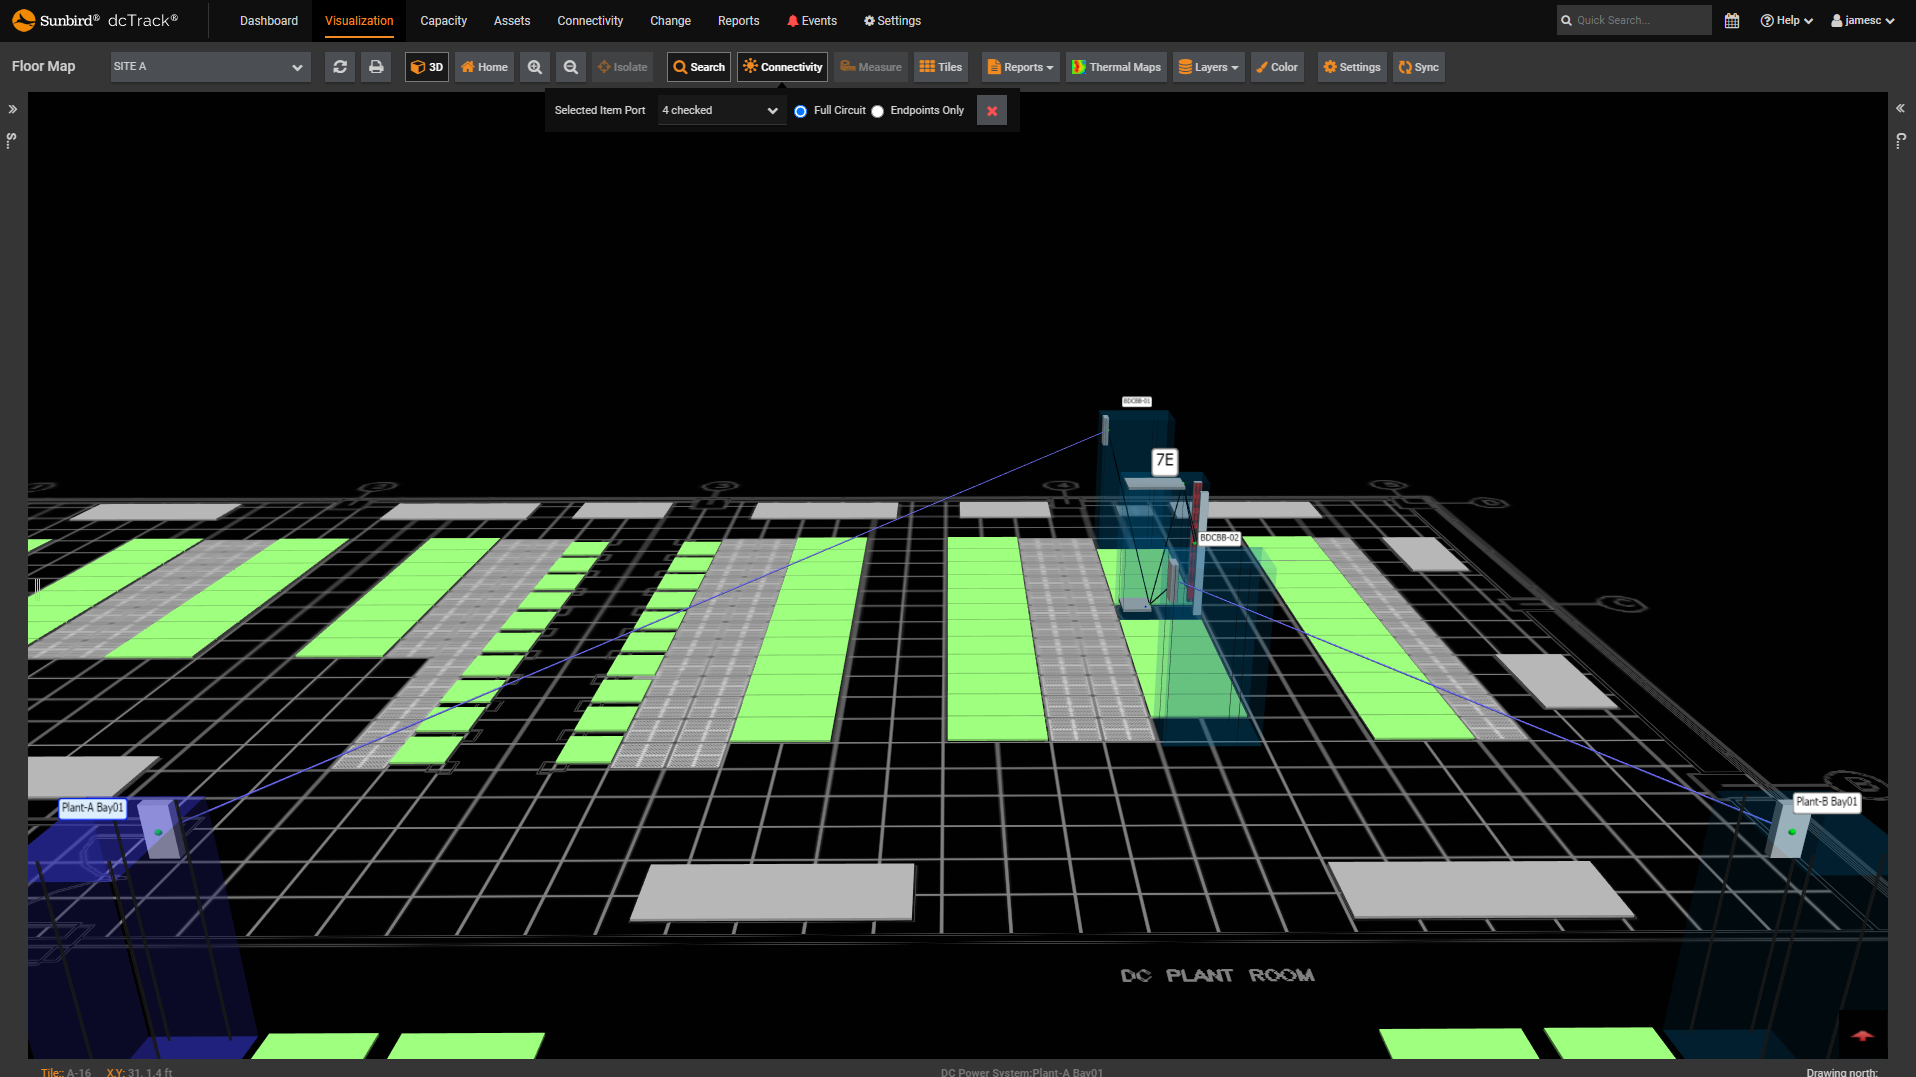
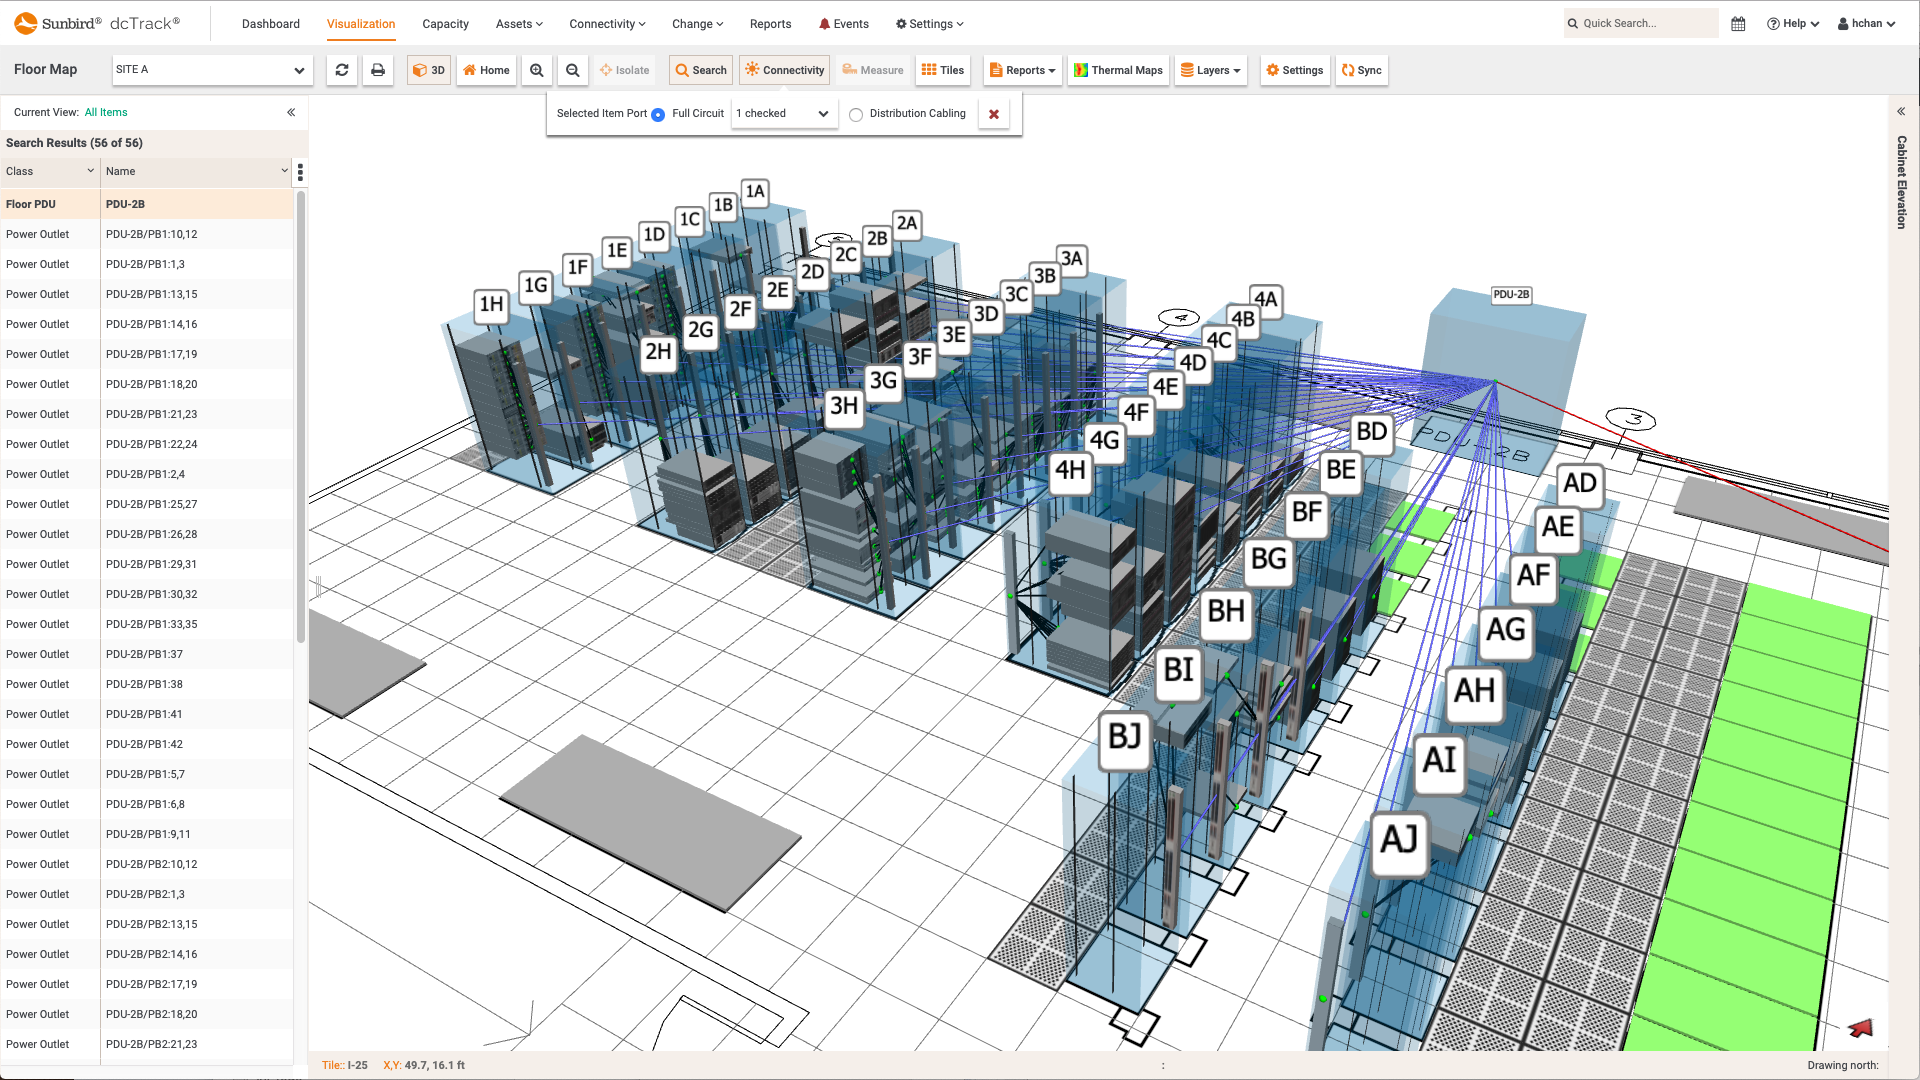
    Sunbird's 3D data center floor map visualizations display data and power connectivity for multiple ports. You can view the full circuit or just the connections between the endpoints only.

    dcTrack DCIM Operations | Connectivity | Visualization
    3D View - What's Connected to What
  • Screenshot of Cable Measurements on the Data Center Floor Map
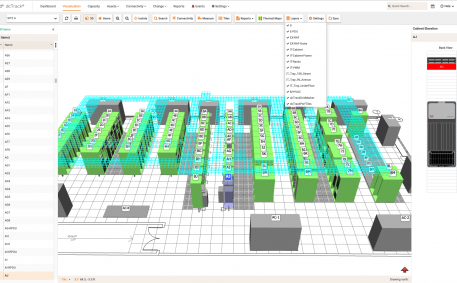
    Screenshot of Cable Measurements on the Data Center Floor Map
    Cable Measurements on the Data Center Floor Map

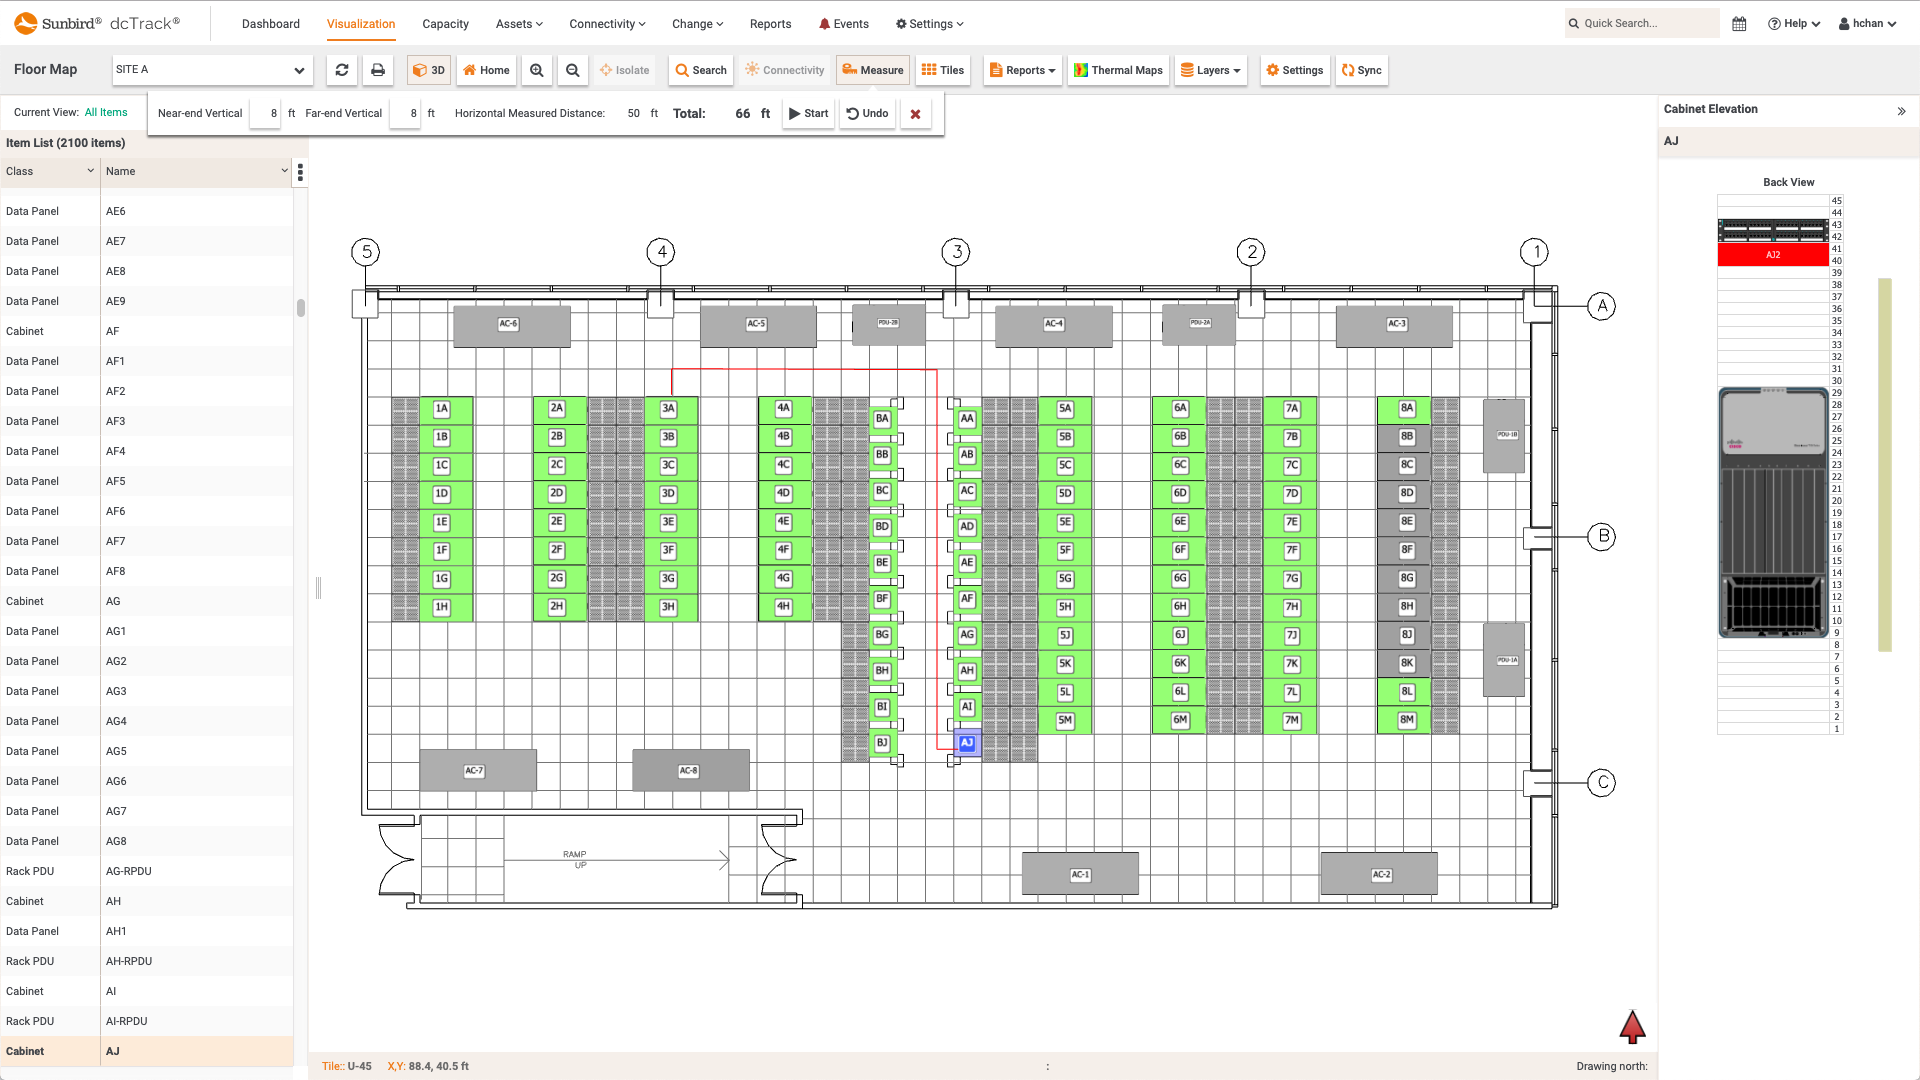
    Sunbird's data center floor map visualizations allow you to measure the distance, including the near- and far-end vertical distances, to accurately determine the amount of cabling you need to connect assets.

    dcTrack DCIM Operations | Connectivity | Visualization
    Cable Measurements on the Data Center Floor Map
  • Screenshot of Cable Trays on the Data Center Floor Map
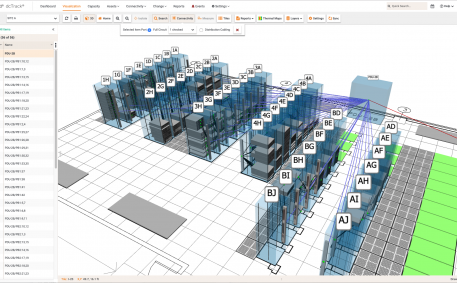
    Screenshot of Cable Trays on the Data Center Floor Map
    Cable Trays on the Data Center Floor Map

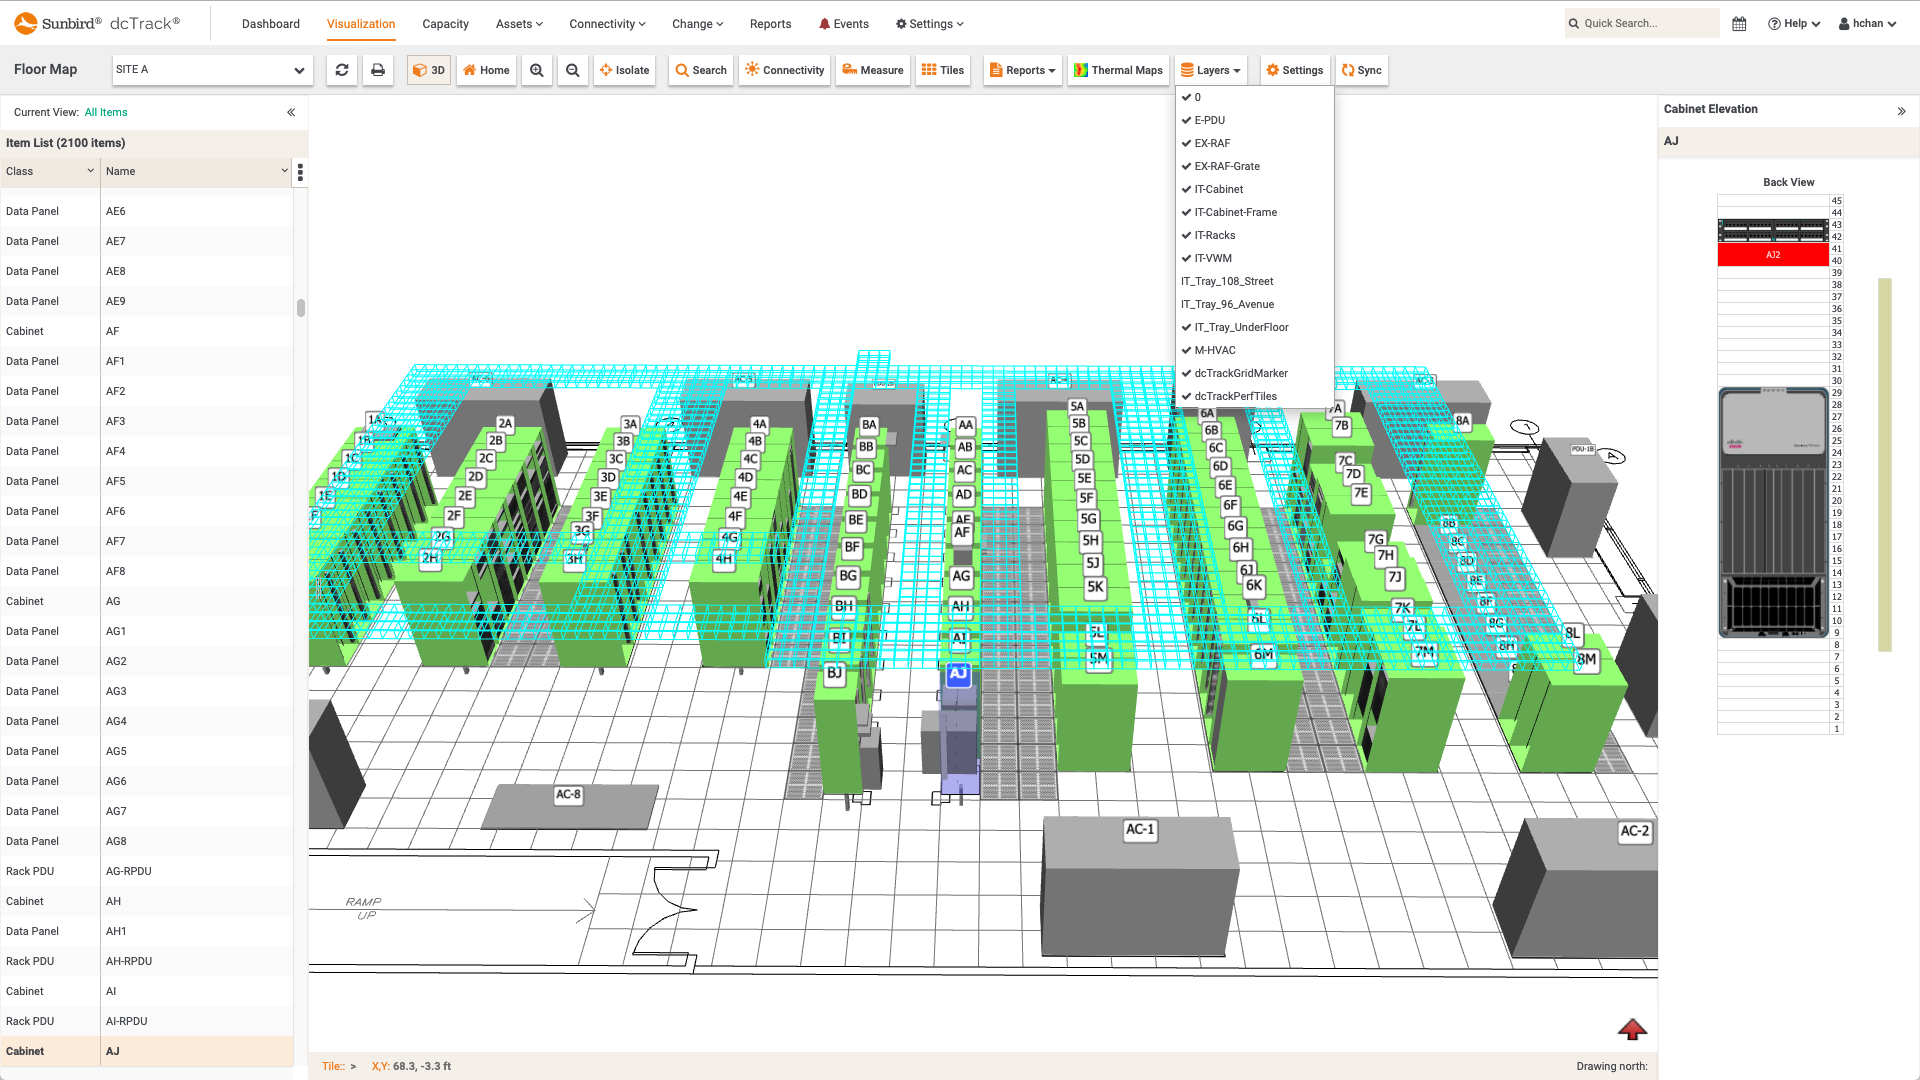
    Sunbird's 3D floor map visualizations display individual layers in your Visio or AutoCAD drawing files so you can view the cable trays across your data center.

    dcTrack DCIM Operations | Connectivity | Visualization
    Cable Trays on the Data Center Floor Map
  • Screenshot of Multiple Floor Map Reports
    Screenshot of Multiple Floor Map Reports
    Multiple Floor Map Reports

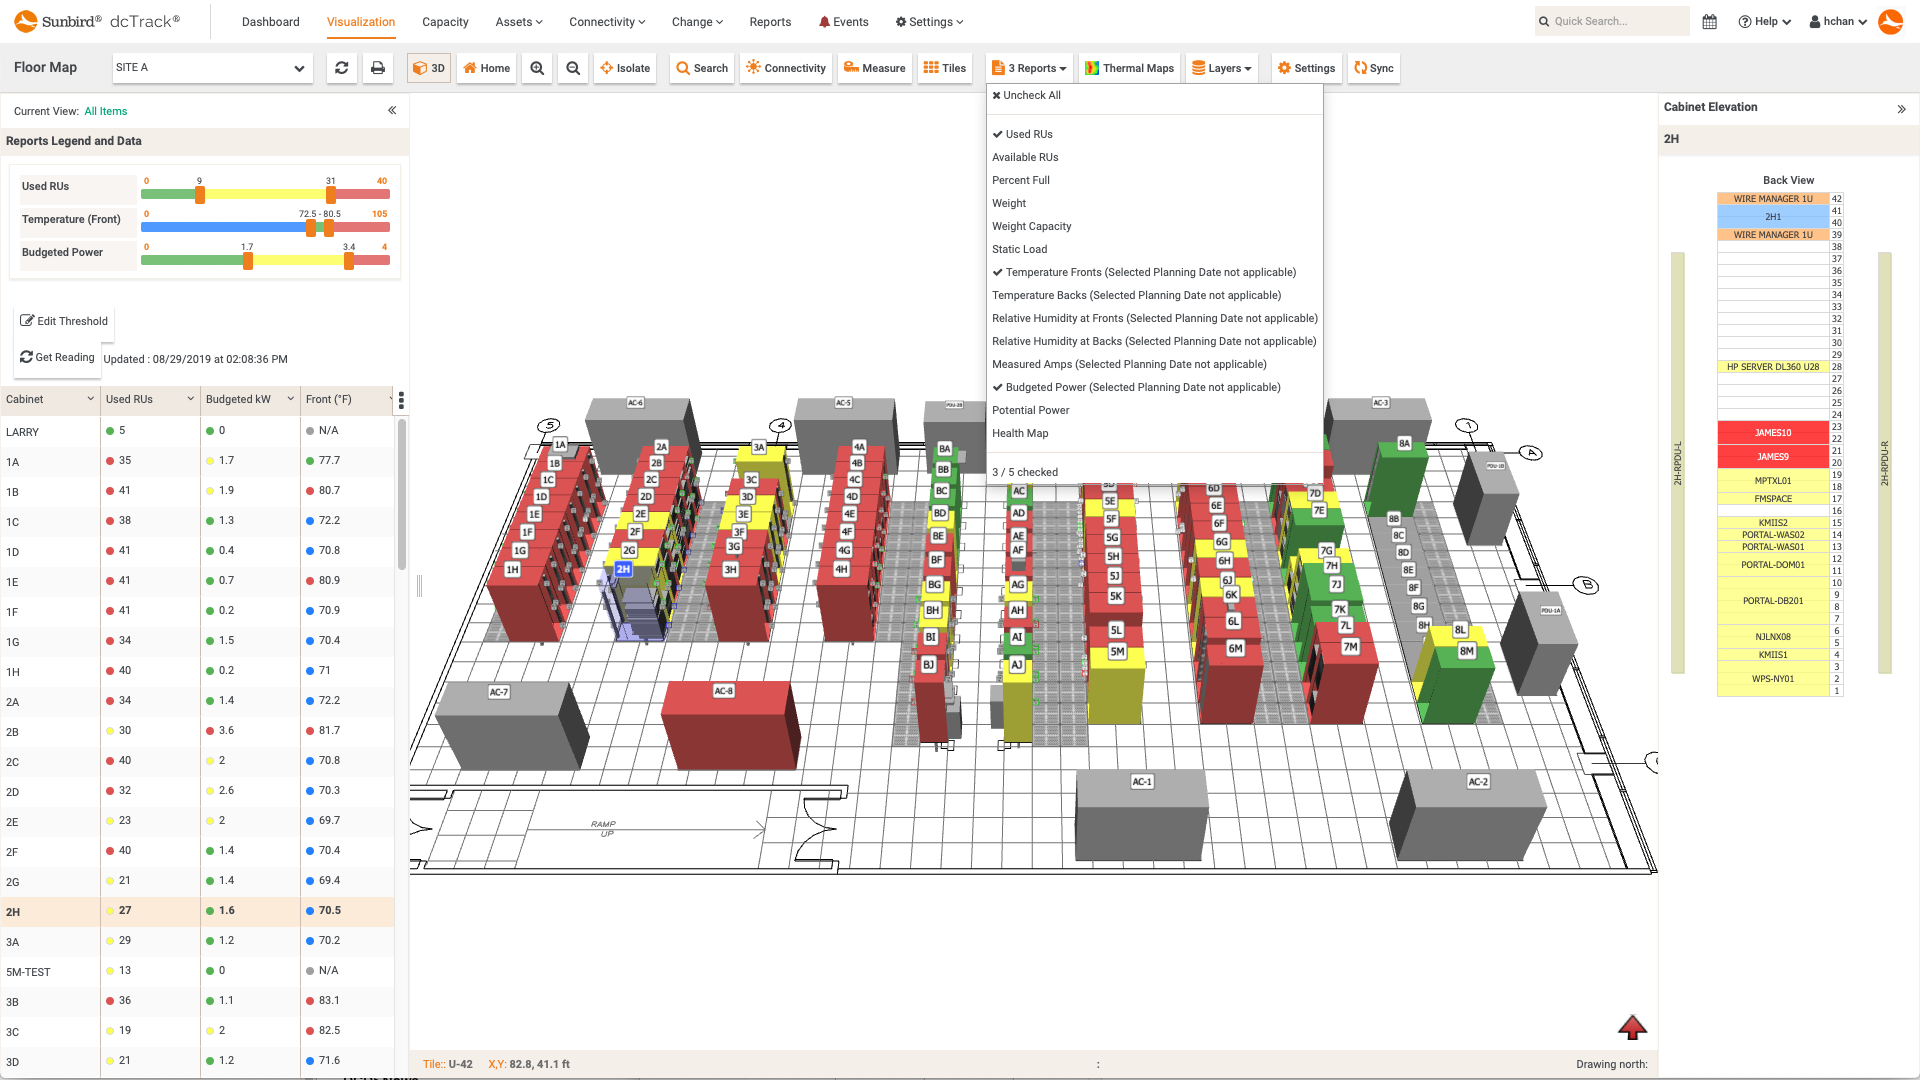
    Sunbird's 3D floor map visualizations enable you to overlay multiple data center capacity, environmental, and power reports to correlate data.

    dcTrack DCIM Operations | Visualization | BI & Data Analytics
    Multiple Floor Map Reports
  • Screenshots of Power Ports Displayed in Asset Details
    Screenshots of Power Ports Displayed in Asset Details
    Power Ports Displayed in Asset Details

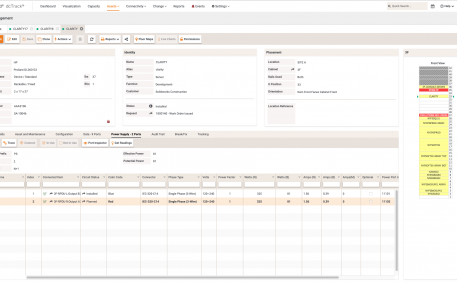
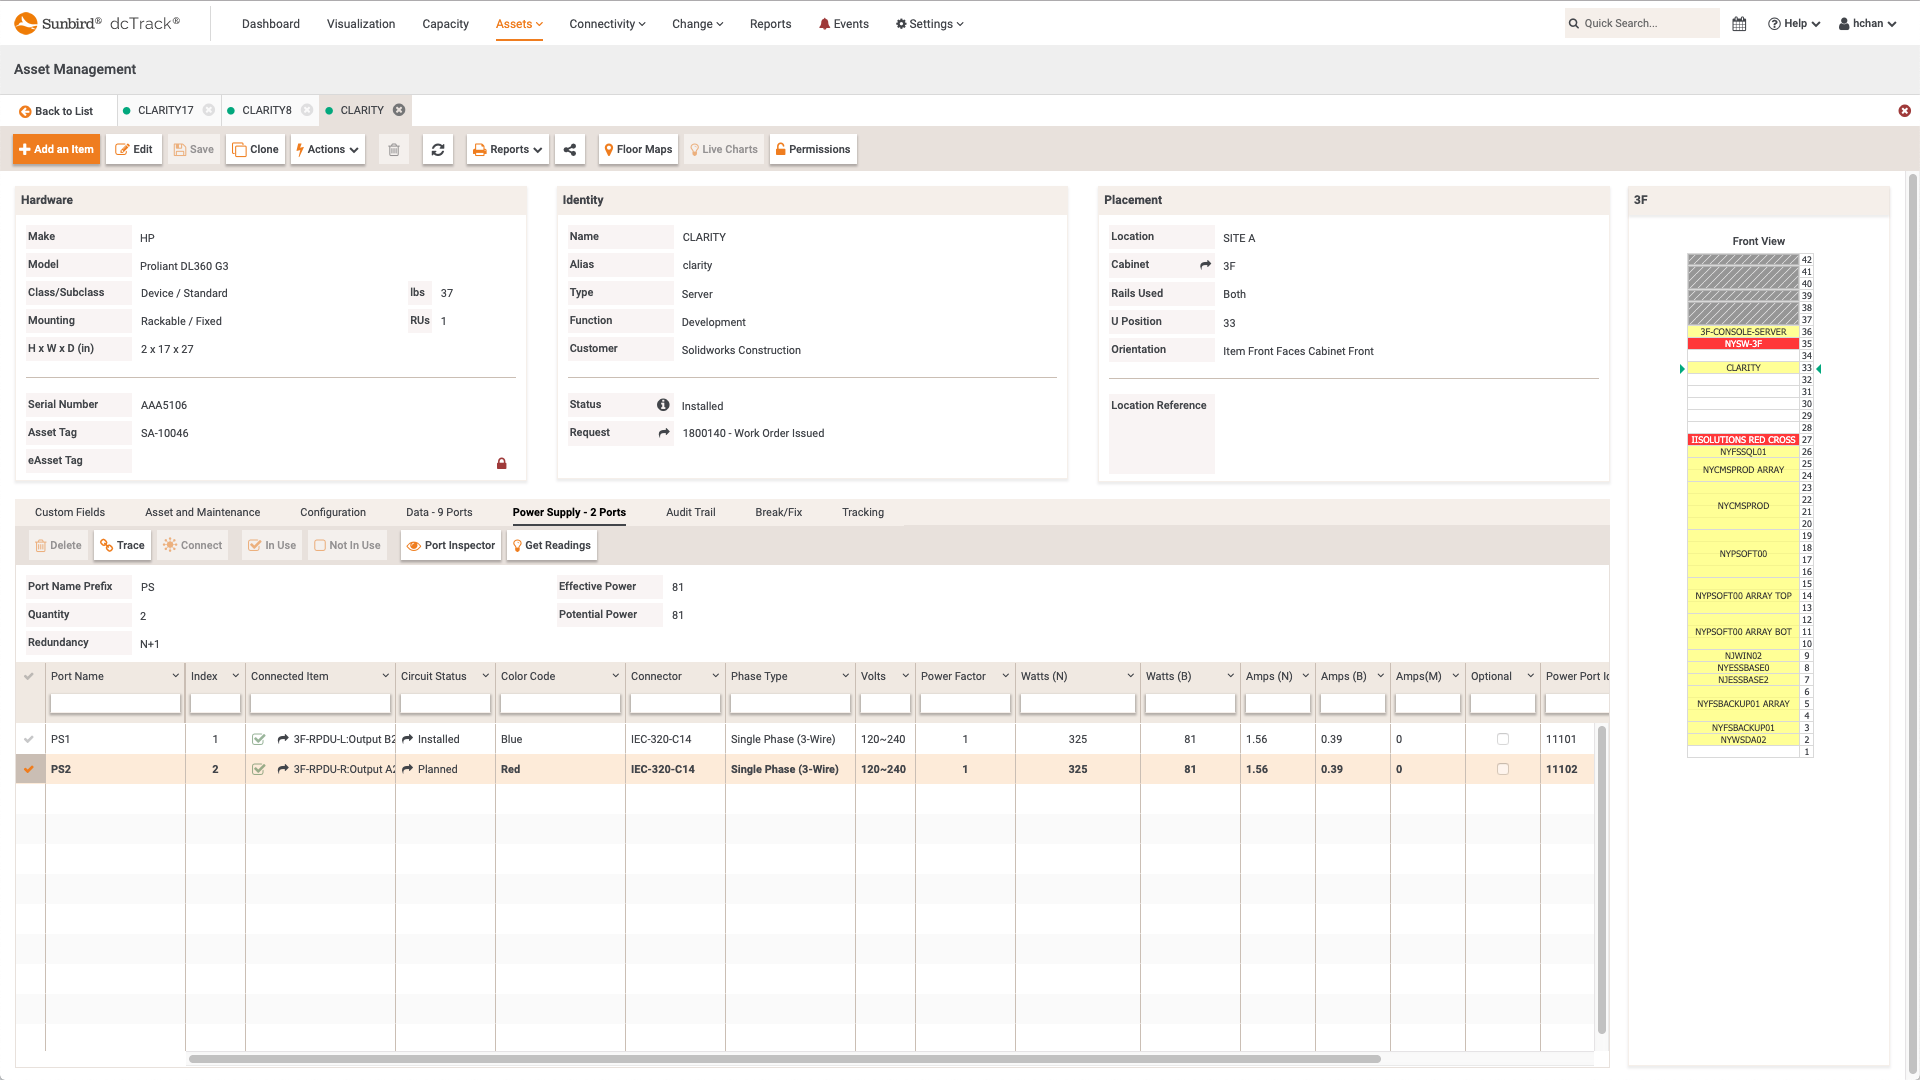
    Asset detail pages provide information on power ports, including connected items, circuit statuses, phase type and power factor.

    dcTrack DCIM Operations | Asset Management | Power Management | Connectivity
    Power Ports Displayed in Asset Details
  • Screenshot of Data Ports Displayed in Asset Details
    Screenshot of Data Ports Displayed in Asset Details
    Data Ports Displayed in Asset Details

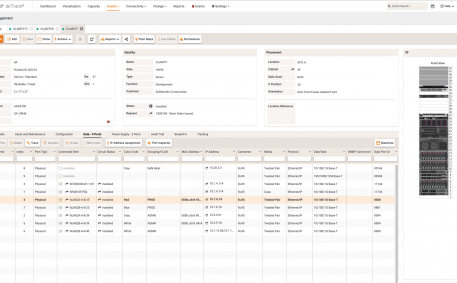
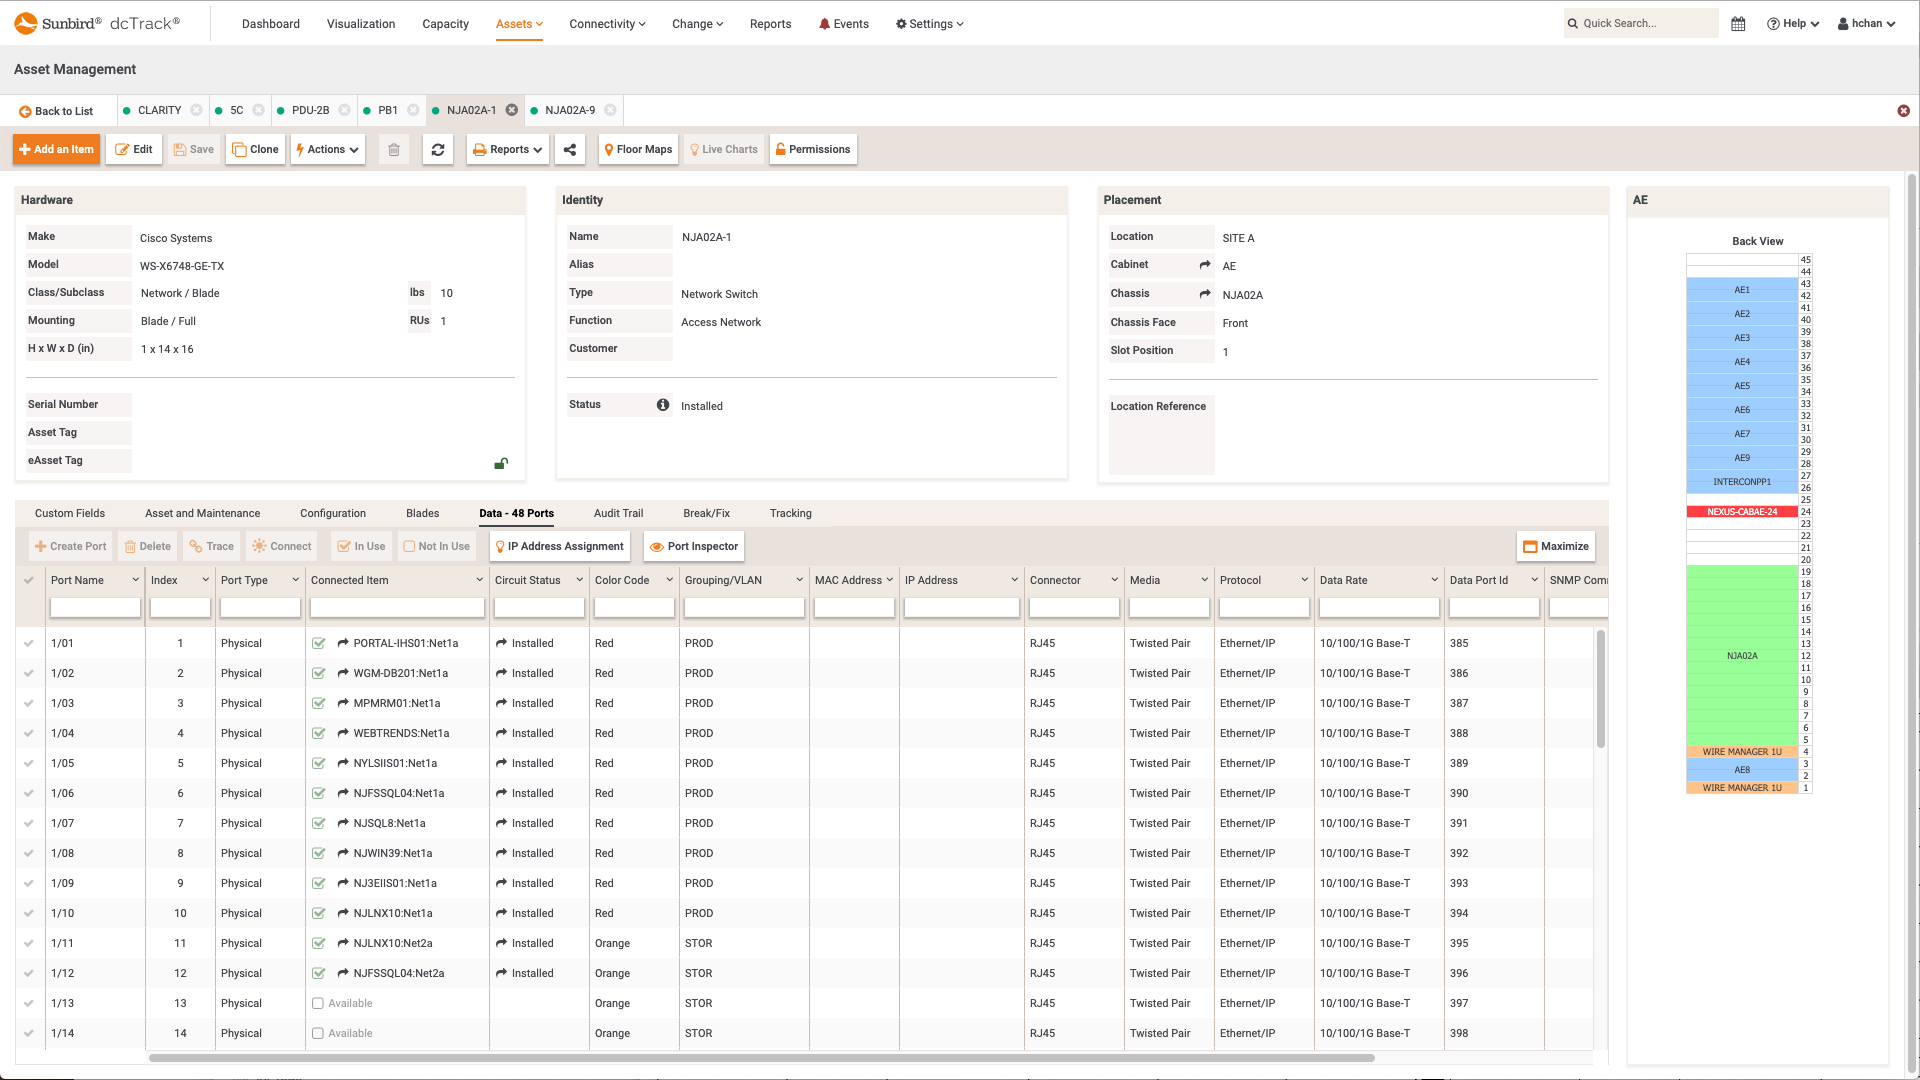
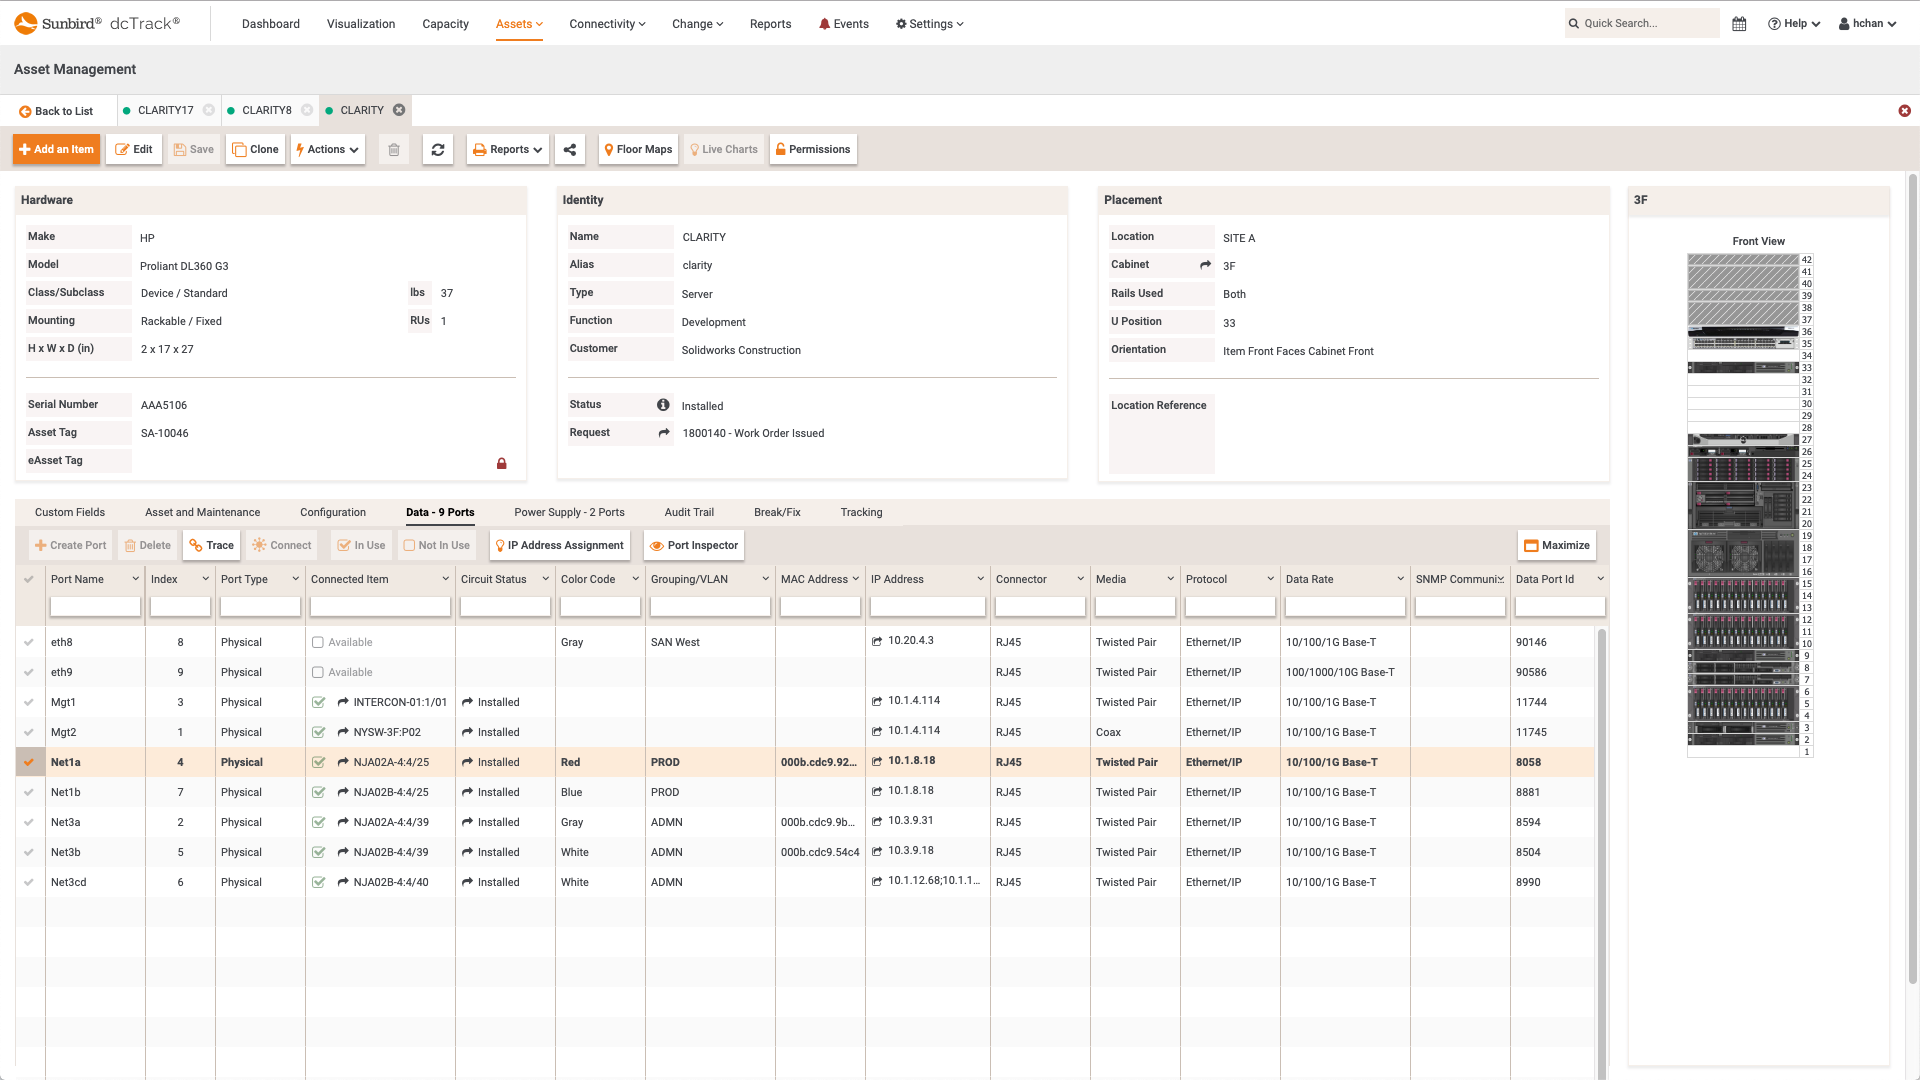
    Asset detail pages provide information on data ports, including connected items, circuit statuses, and IP addresses.

    dcTrack DCIM Operations | Asset Management | Connectivity
    Data Ports Displayed in Asset Details
  • Screenshot of Isolated Cabinet View with Environmental Reporting
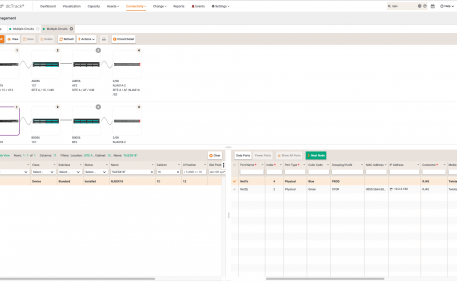
    Screenshot of Isolated Cabinet View with Environmental Reporting
    Isolated Cabinet View with Environmental Reporting

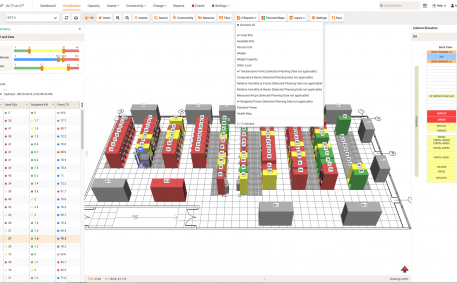
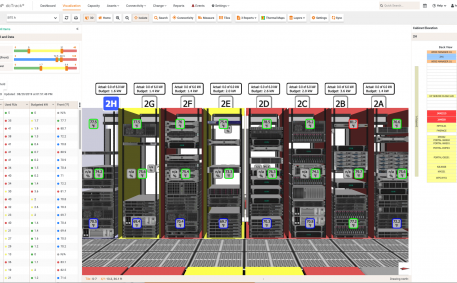
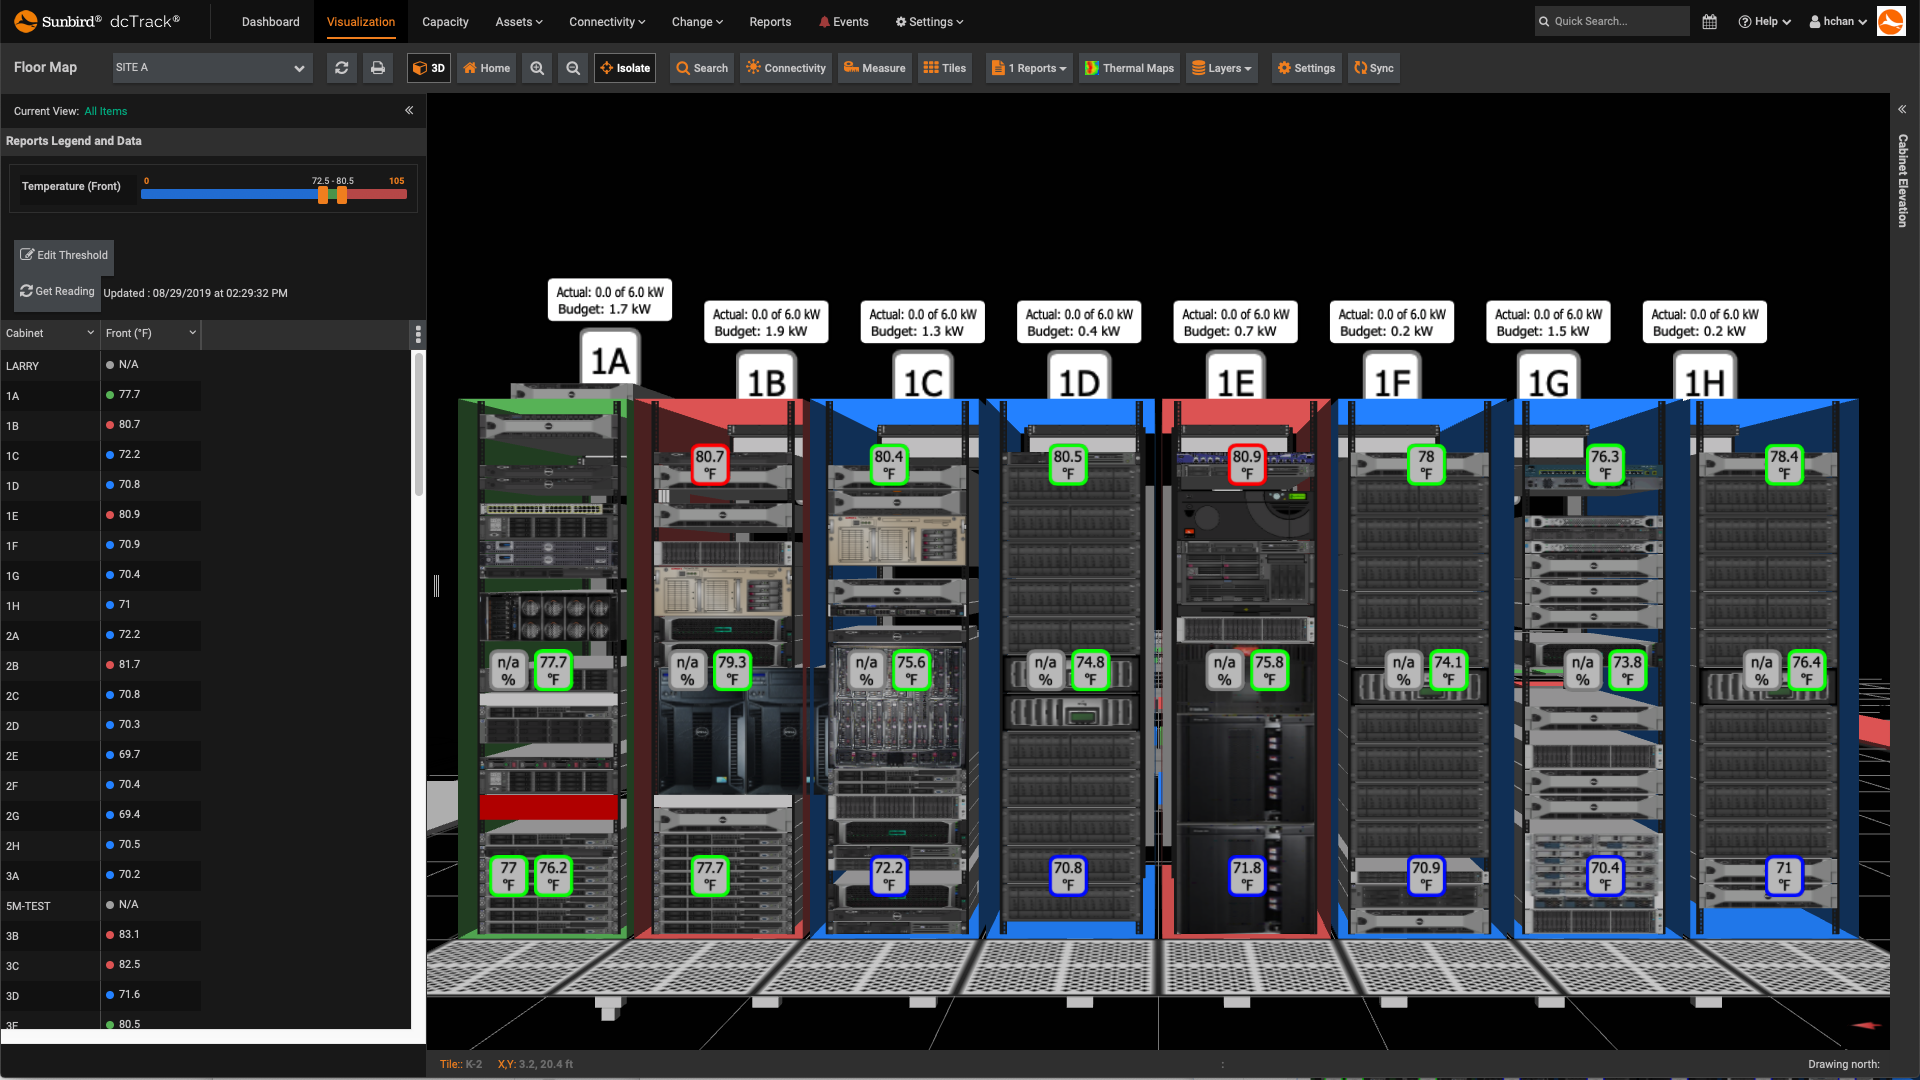
    Any of Sunbird's data center floor map reports can be overlaid on an isolated view of cabinets. This example displays an isolated row of cabinets with the Temperature per Cabinet Fronts report overlay.

    dcTrack DCIM Operations | Environment Management | Visualization
    Isolated Cabinet View with Environmental Reporting
  • Screenshot of Multiple Data Circuit Traces from Redundant NICs
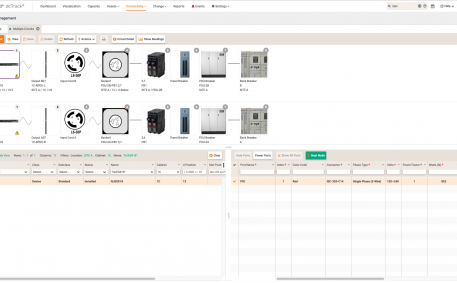
    Screenshot of Multiple Data Circuit Traces from Redundant NICs
    Multiple Data Circuit Traces from Redundant NICs

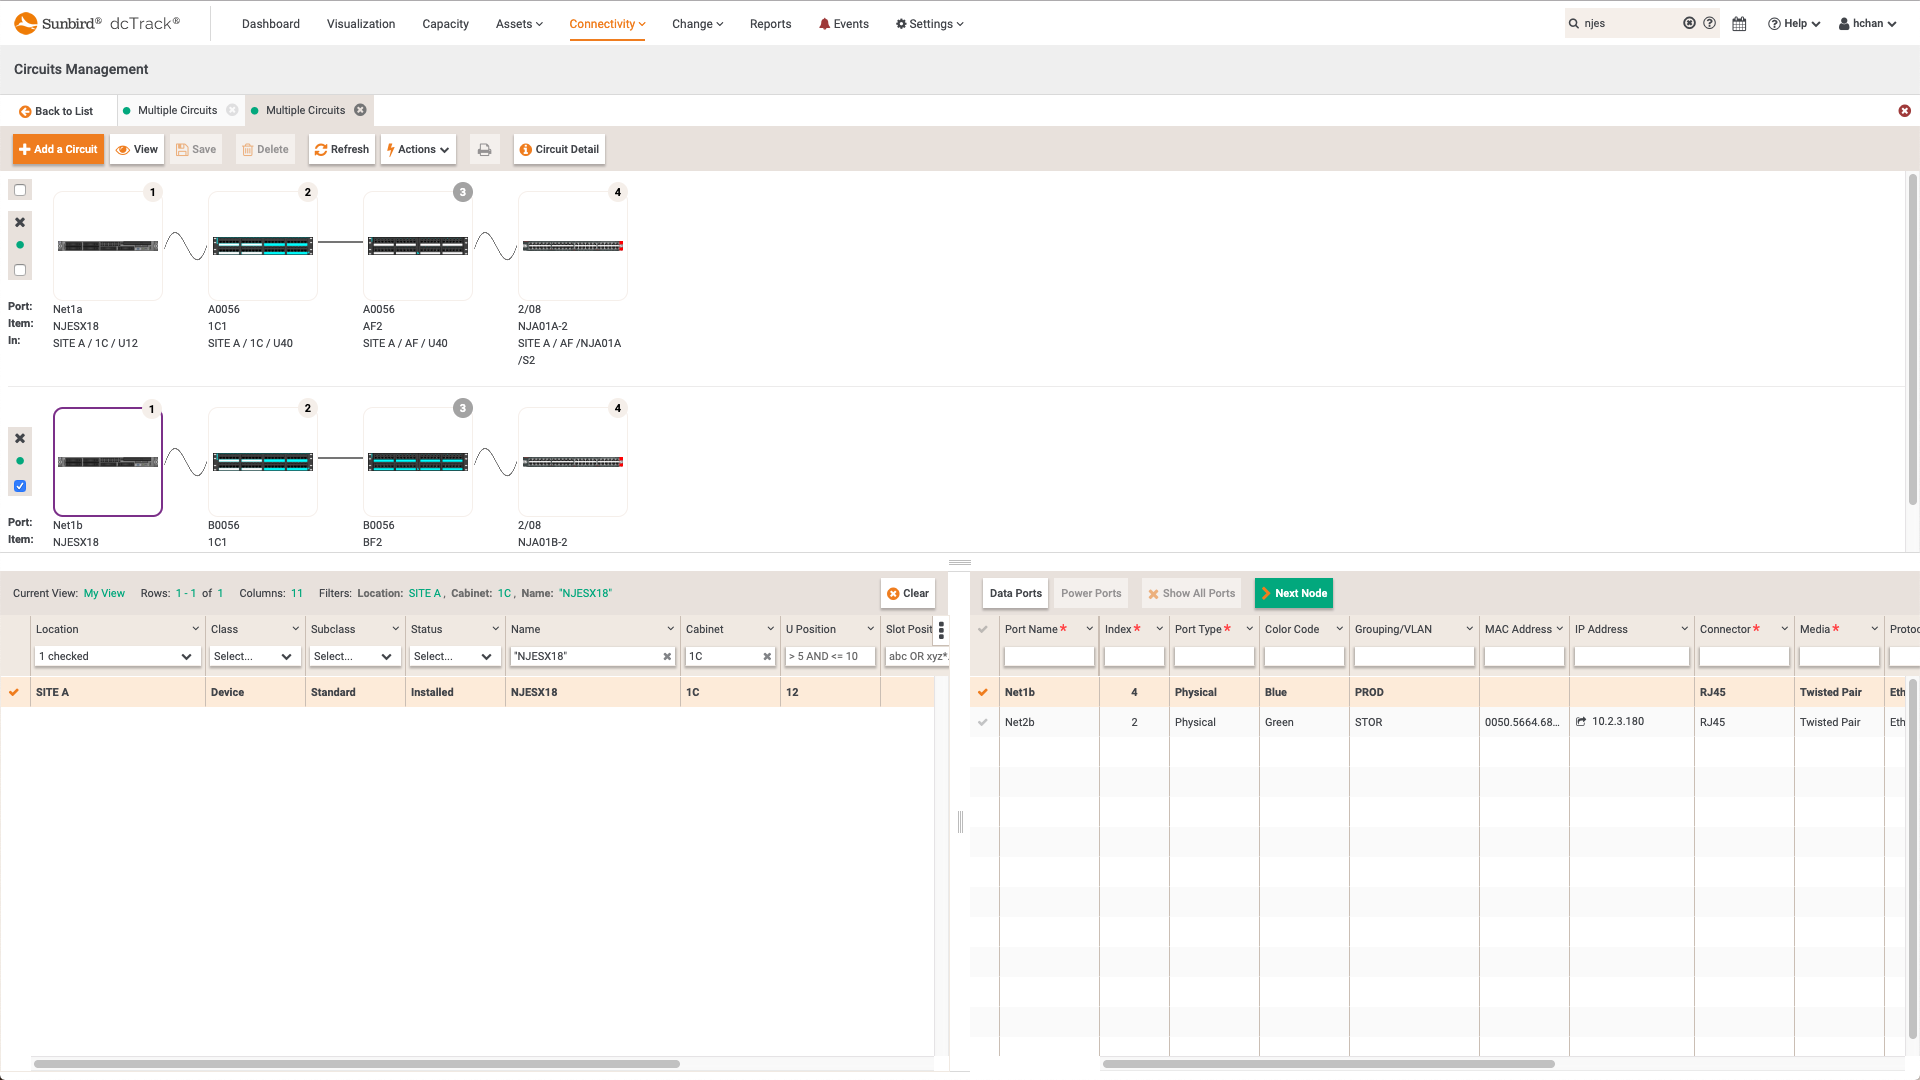
    Each node and connection in a data circuit is displayed using a graphical representation of the circuit. You can view the complete circuit from the starting item to the ending item, including each item in between.

    dcTrack DCIM Operations | Connectivity | Capacity Management | Power Management | Visualization
    Multiple Data Circuit Traces from Redundant NICs
  • Screenshot of Multiple Power Circuit Trace from Redundant Power Supplies
    Screenshot of Multiple Power Circuit Trace from Redundant Power Supplies
    Multiple Power Circuit Trace from Redundant Power Supplies

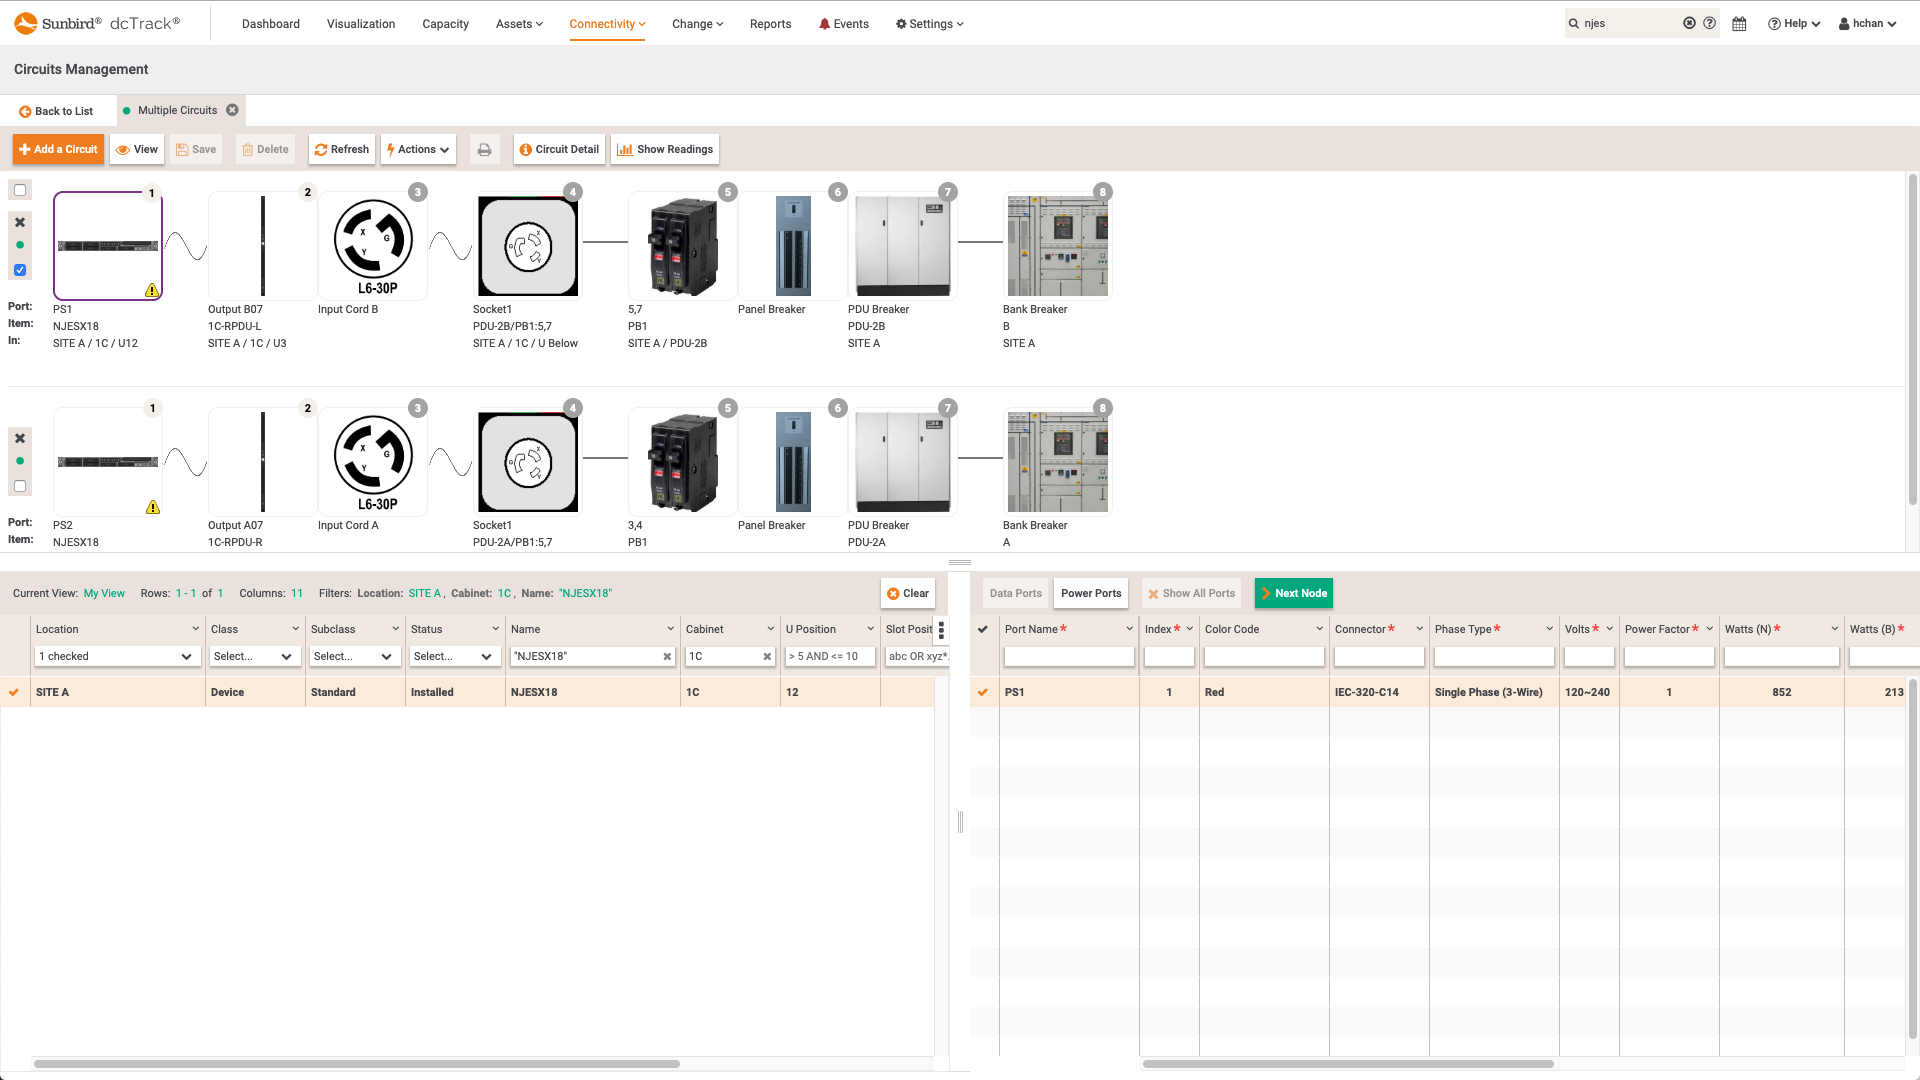
    Each node and connection in a power circuit is displayed using a graphical representation of the circuit. You can view the complete circuit from the starting item to the ending item, including each item in between.

    dcTrack DCIM Operations | Connectivity | Capacity Management | Power Management | Visualization
    Multiple Power Circuit Trace from Redundant Power Supplies
  • Screenshot of Floor Map Search Results
    Screenshot of Floor Map Search Results
    Floor Map Search Results

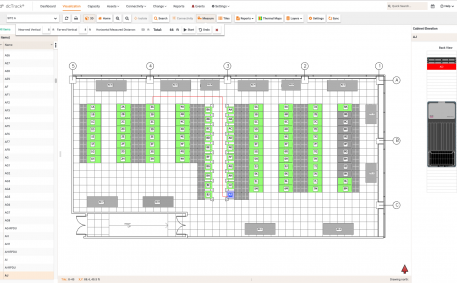
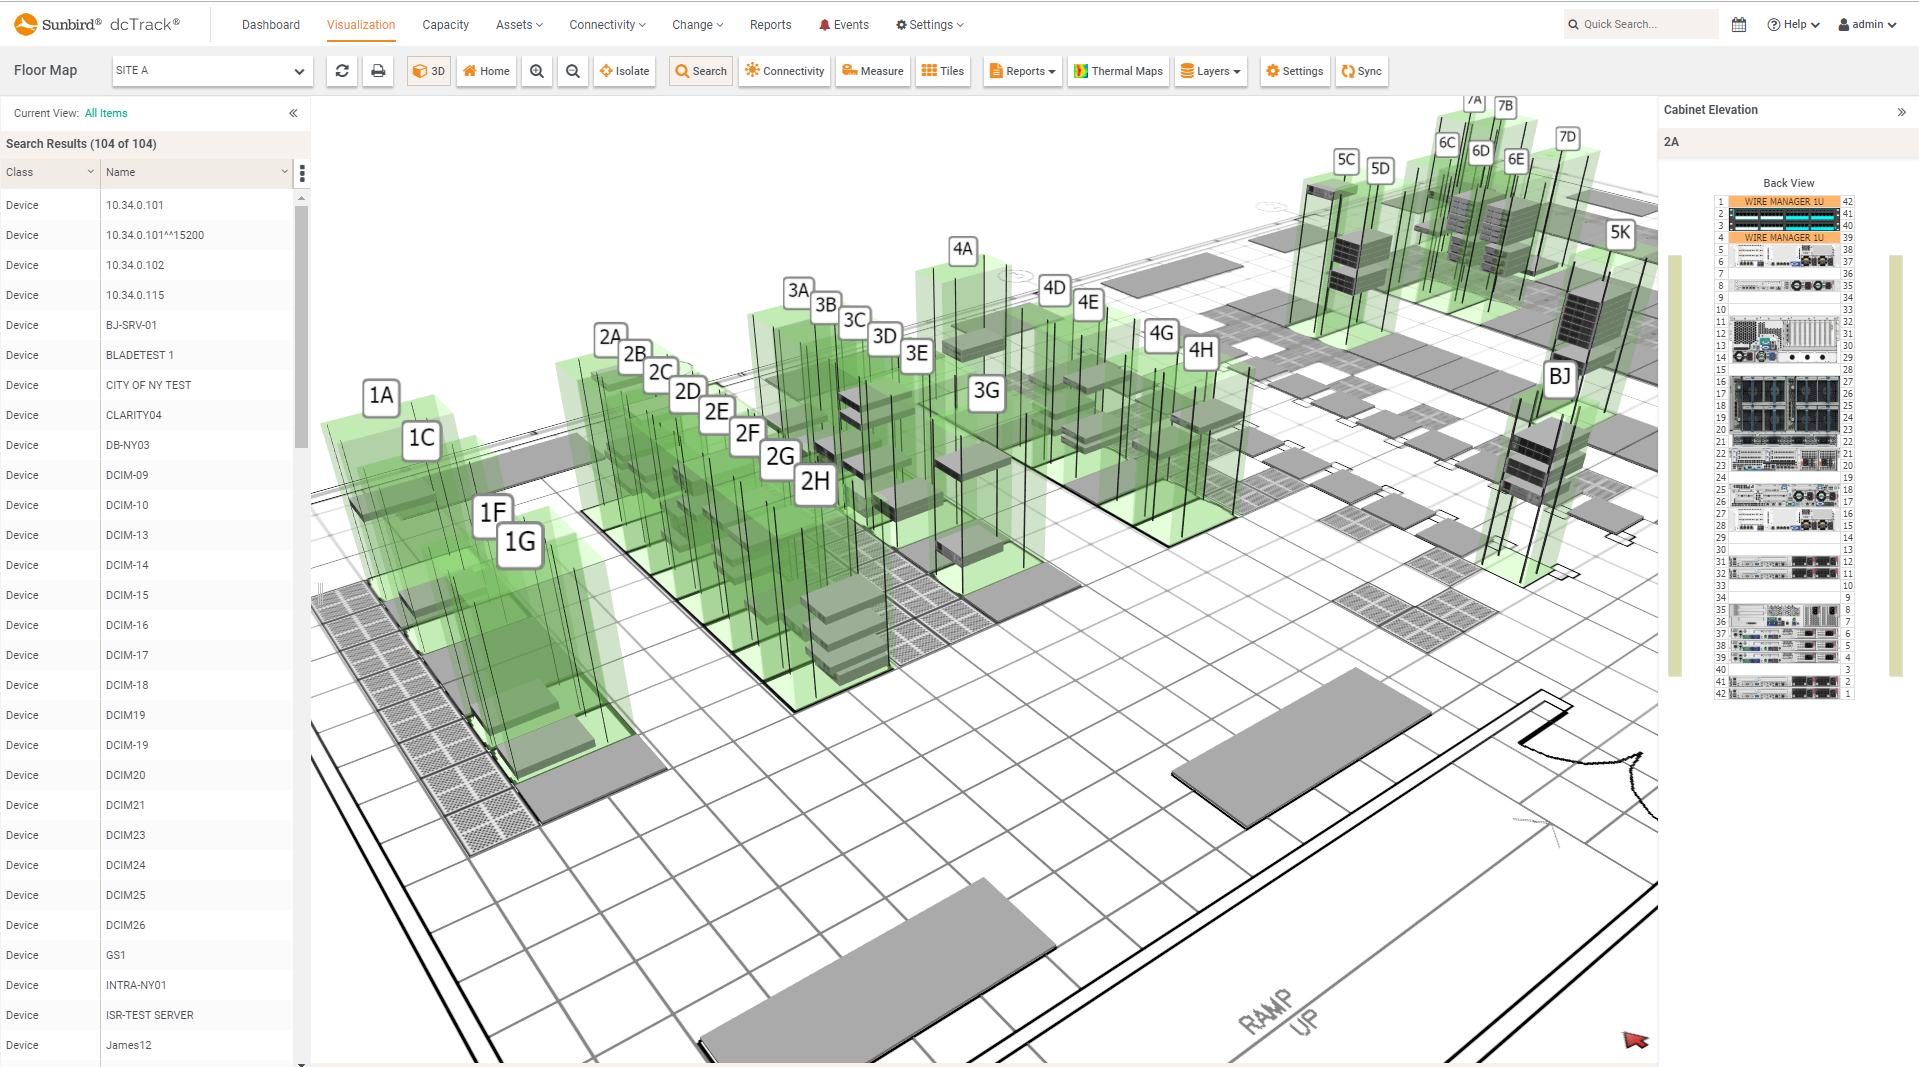
    The floor map can be searched for assets, and the results are displayed in a tabular format and visually by isolating the cabinets where the asset is located. When a cabinet is selected, it will show in the cabinet elevation view. 

    dcTrack DCIM Operations | Visualization | Asset Management
    Floor Map Search Results
  • Screenshot of Horizontal Thermal Time-Lapse Video
    Screenshot of Horizontal Thermal Time-Lapse Video
    Horizontal Thermal Time-Lapse Video

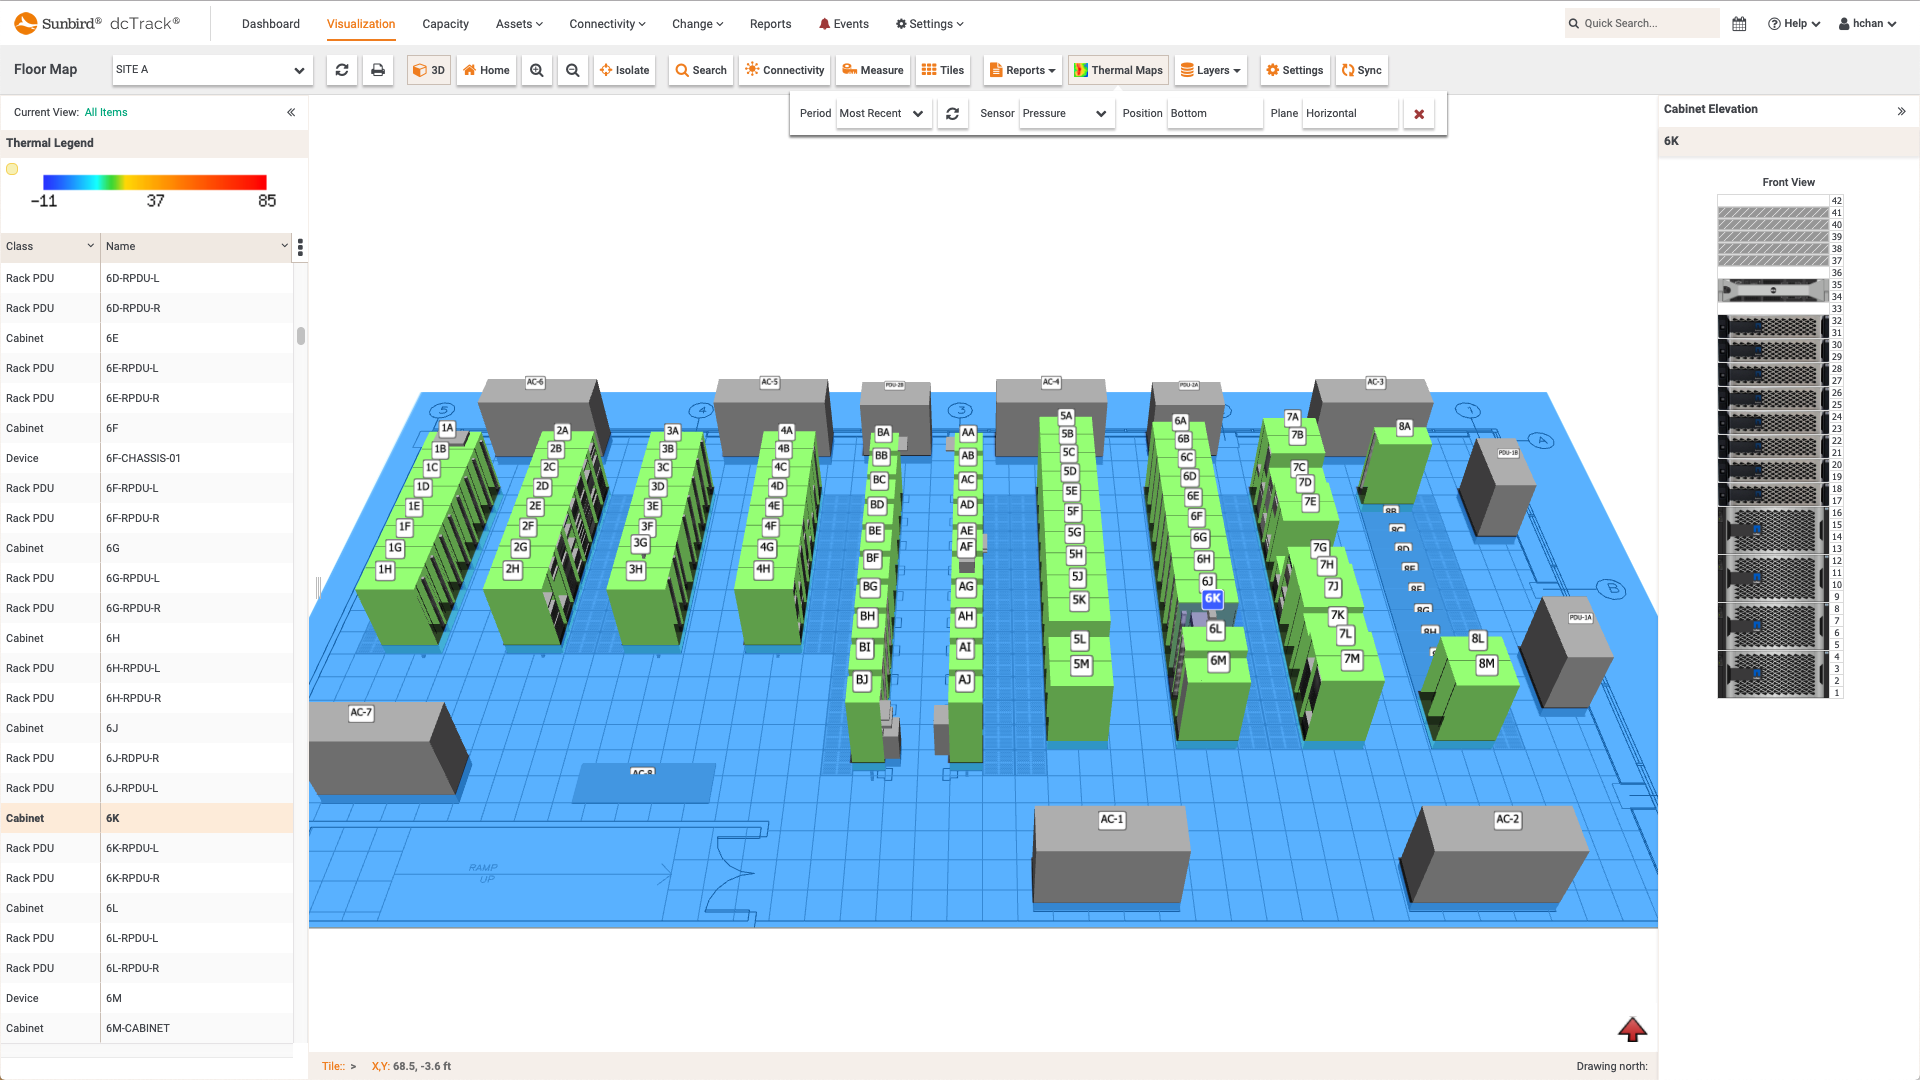
    The horizontal thermal time-lapse video displays cooling data from environmental sensors across your data center floor.

    dcTrack DCIM Operations | BI & Data Analytics | Visualization | Environment Management
    Horizontal Thermal Time-Lapse Video
  • Screenshot of Isolated Cabinet View with Multiple Reports
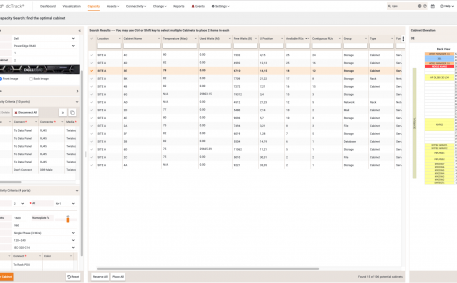
    Screenshot of Isolated Cabinet View with Multiple Reports
    Isolated Cabinet View with Multiple Reports

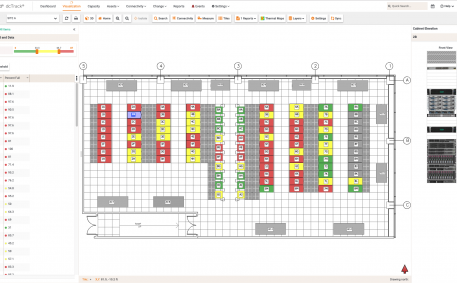
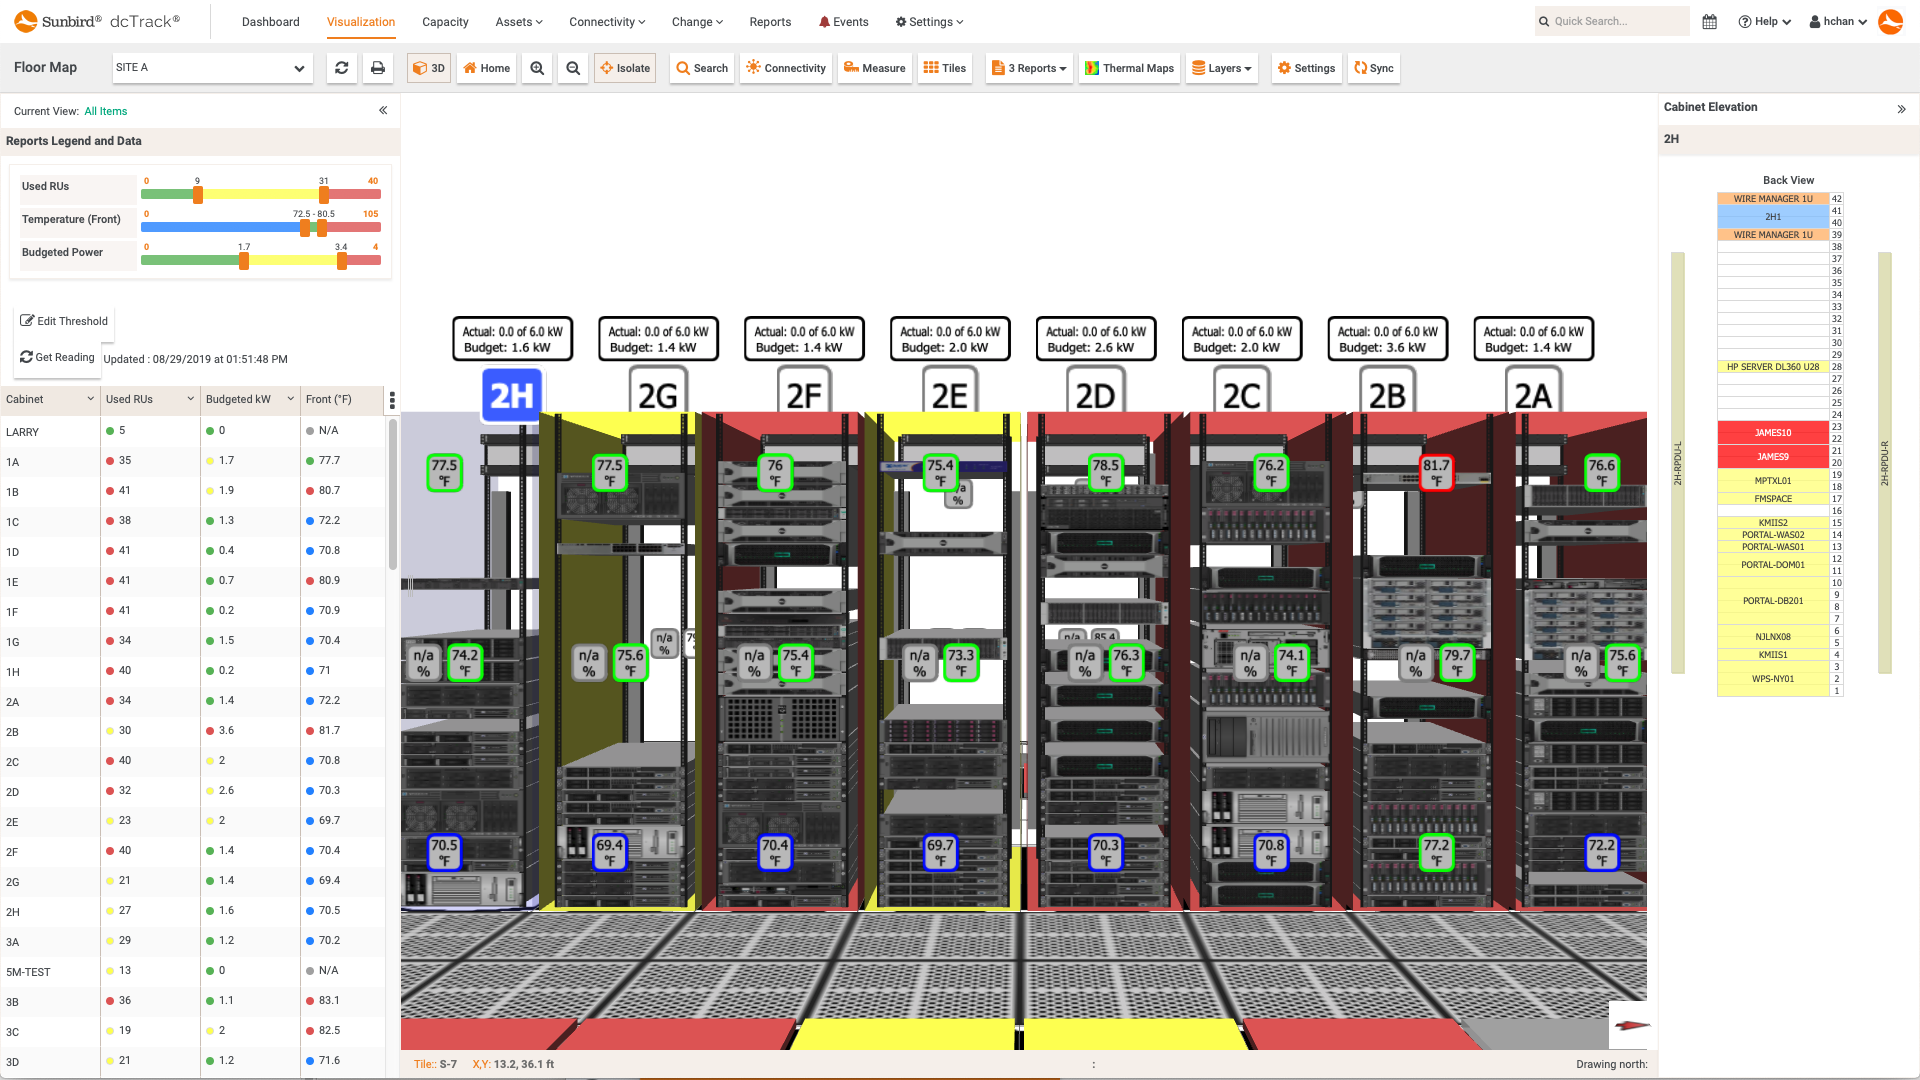
    The Isolate feature allows users to select one or more cabinets to view their contents and other information, such as environmental and power data.

    dcTrack DCIM Operations | BI & Data Analytics | Visualization
    Isolated Cabinet View with Multiple Reports
  • Screenshot of Intelligent Capacity Search for Space, Power, and Data Connectivity
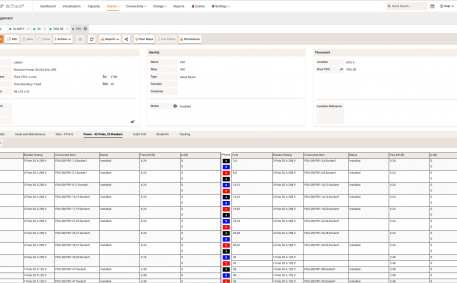
    Screenshot of Intelligent Capacity Search for Space, Power, and Data Connectivity
    Intelligent Capacity Search for Space, Power, and Data Connectivity

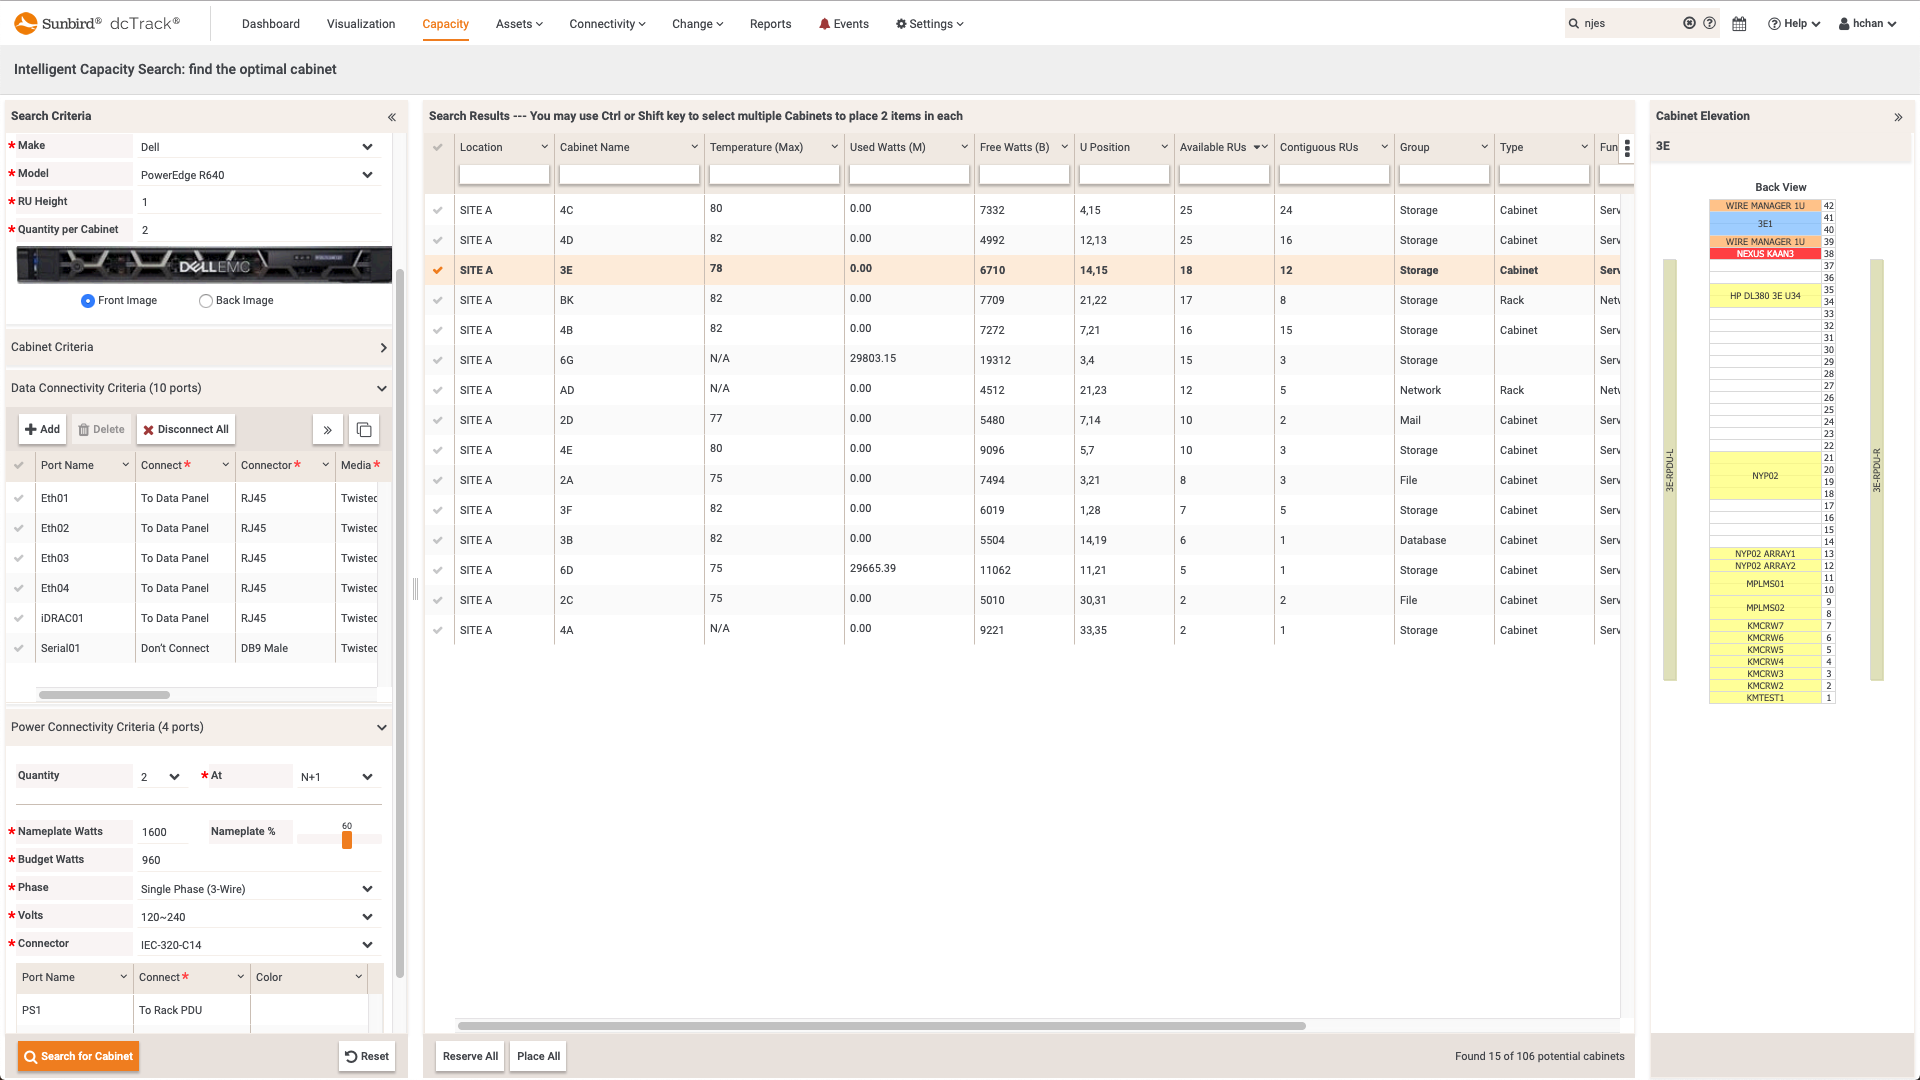
    Sunbird's Intelligent Capacity Search helps you locate cabinet space an item or qualify the space for your item based on model, make, RUs, and other specifications. 

    dcTrack DCIM Operations | Capacity Management
    Intelligent Capacity Search for Space, Power, and Data Connectivity
  • Screenshot of Floor PDU Panel Details with Panel Schedule
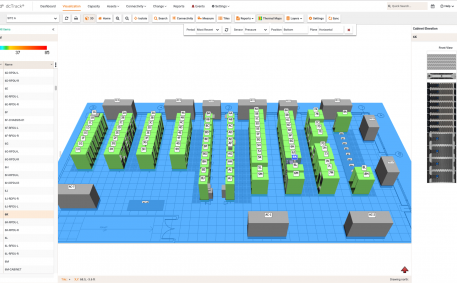
    Screenshot of Floor PDU Panel Details with Panel Schedule
    Floor PDU Panel Details with Panel Schedule

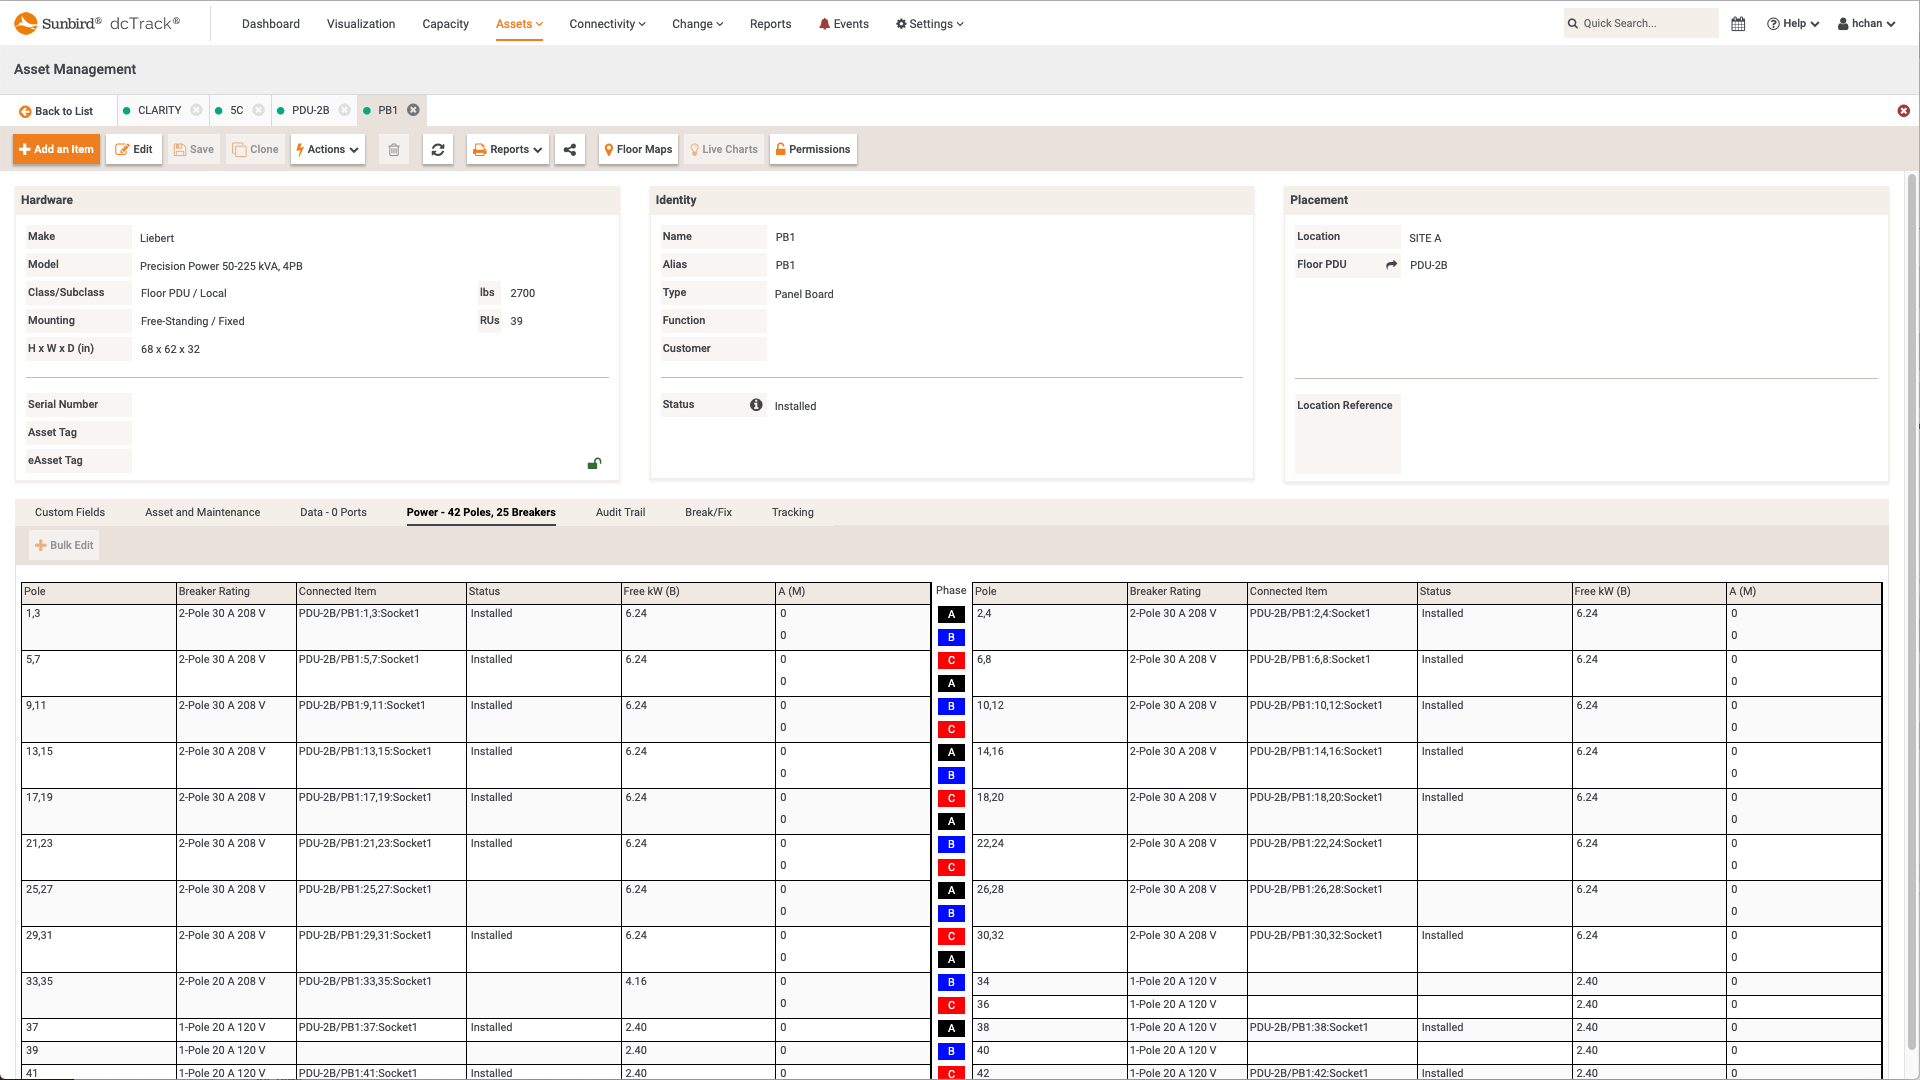
    An Item Details page displays critical information about the item, including make, model, location, custom fields, data ports, and power ports.           

    dcTrack DCIM Operations | Asset Management
    Floor PDU Panel Details with Panel Schedule
  • Screenshot of Pressure Map Time Lapse Video
    Screenshot of Pressure Map Time Lapse Video
    Pressure Map Time Lapse Video

    The Pressure Map Time Lapse Video shows air pressure changes over time in your data center so you can easily spot cooling inefficiencies and can better manage air flow.

    dcTrack DCIM Operations | Environment Management | BI & Data Analytics | Visualization
    Pressure Map Time Lapse Video
  • Screenshot of dcTrack Cabinet Health Floor Map Report
    Screenshot of dcTrack Cabinet Health Floor Map Report
    dcTrack Cabinet Health Floor Map Report

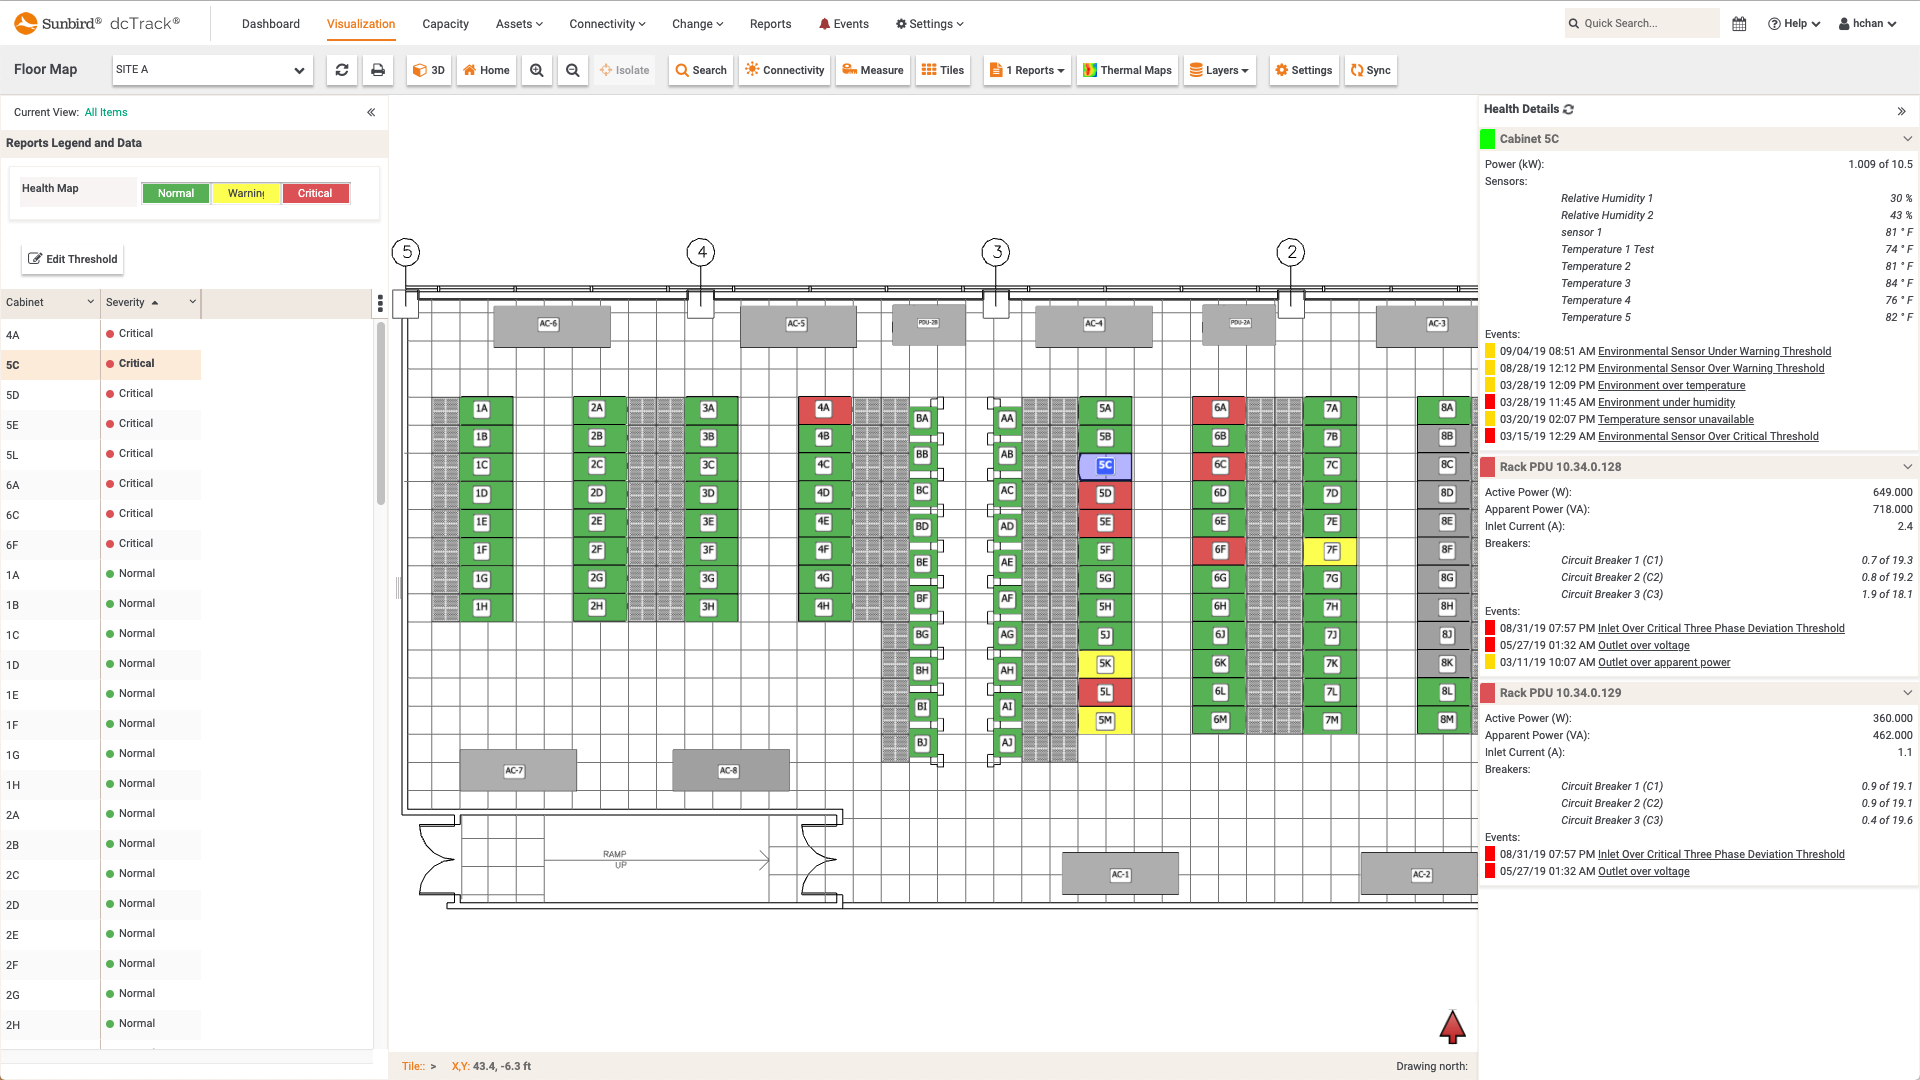
    The dcTrack Health Map report color codes floor items with yellow and red when there are warning or critical level events, respectively, associated with the floor item (based on integration with Power IQ). 

    dcTrack DCIM Operations | Power Management | Environment Management | Capacity Management | BI & Data Analytics | Visualization
    dcTrack Cabinet Health Floor Map Report
  • Screenshot of Budgeted Power per Cabinet Floor Map Report
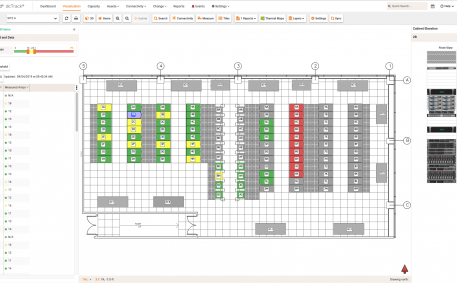
    Screenshot of Budgeted Power per Cabinet Floor Map Report
    Budgeted Power per Cabinet Floor Map Report

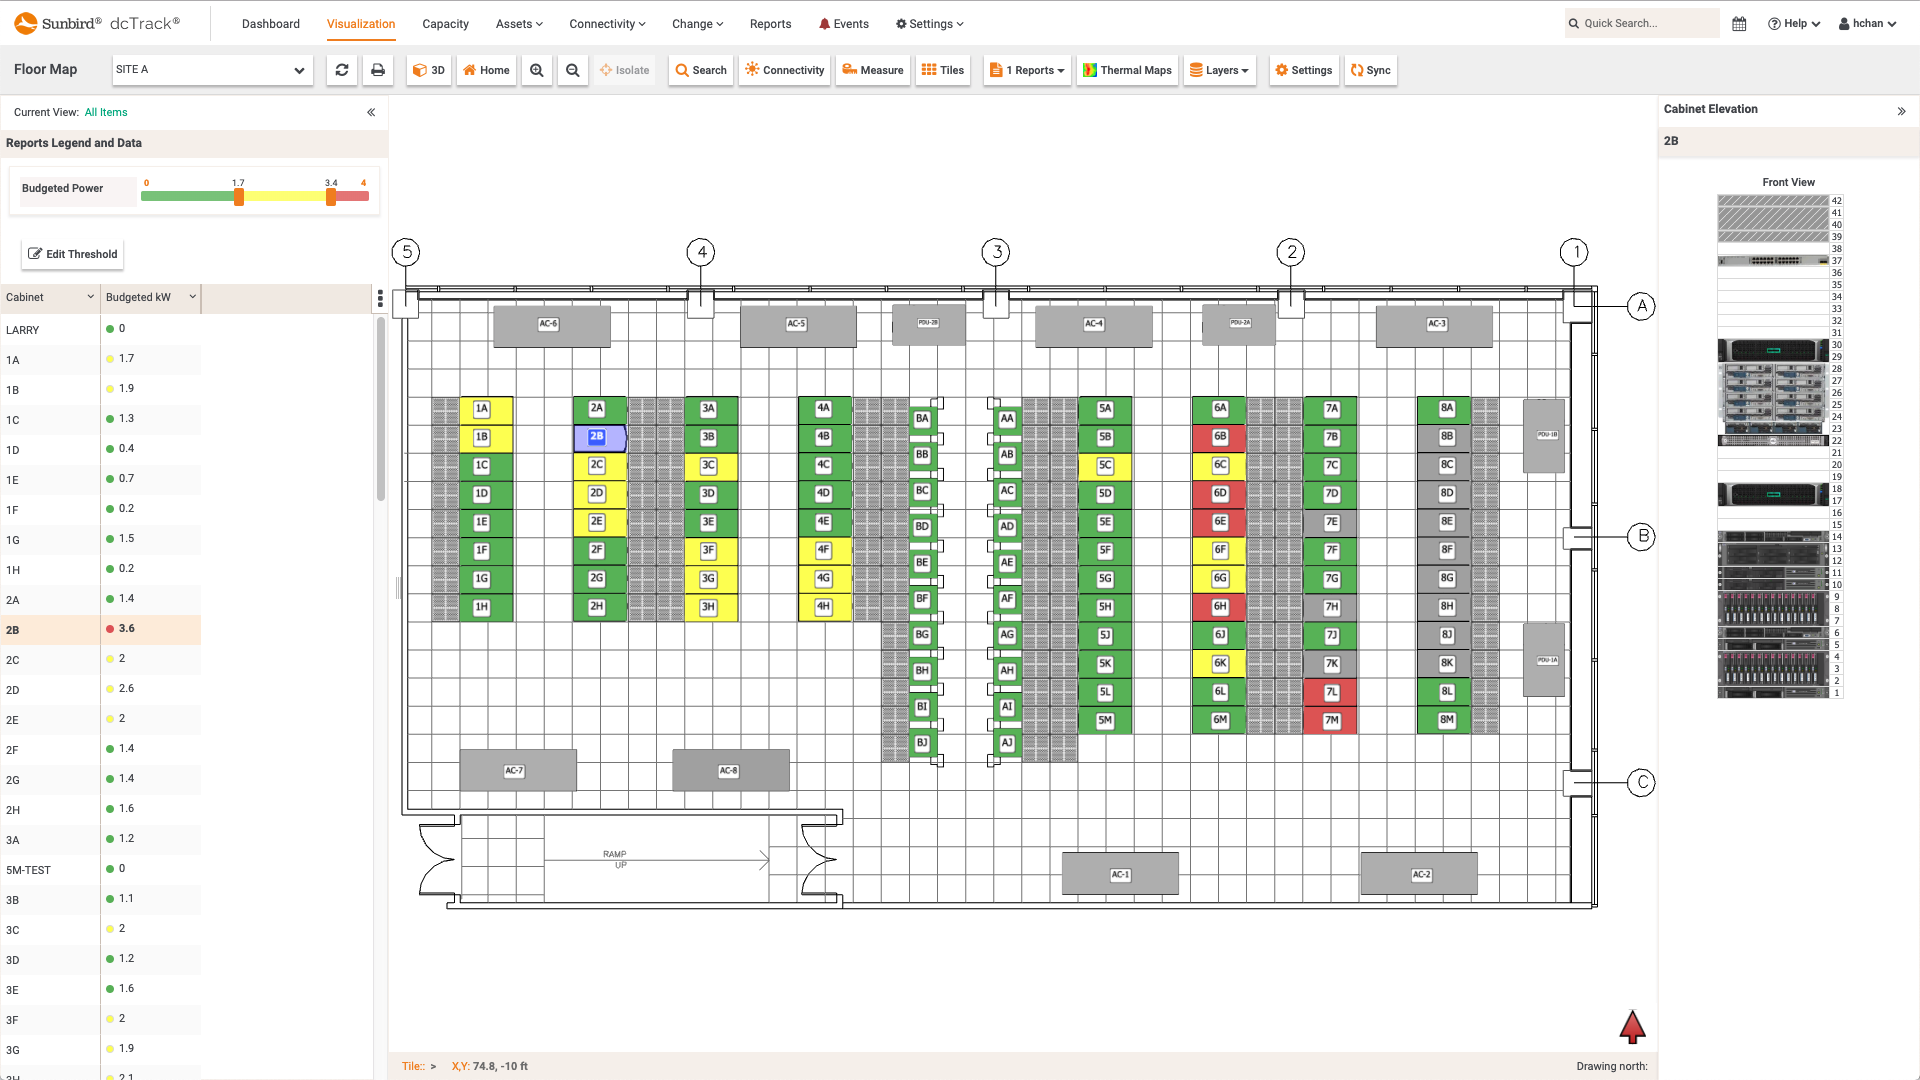
    The Budgeted Power per Cabinet floor map report displays the sum of the budgeted power in kW for each cabinet based on the items in the cabinet.

    dcTrack DCIM Operations | Power Management | BI & Data Analytics | Visualization
    Budgeted Power per Cabinet Floor Map Report
  • Screenshot of Measured Amps per Cabinet Floor Map Report
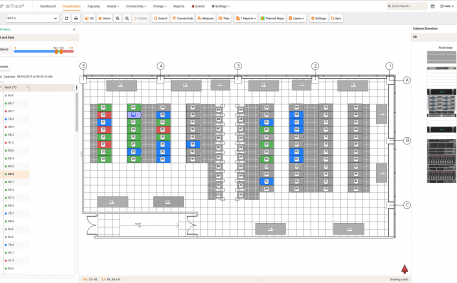
    Screenshot of Measured Amps per Cabinet Floor Map Report
    Measured Amps per Cabinet Floor Map Report

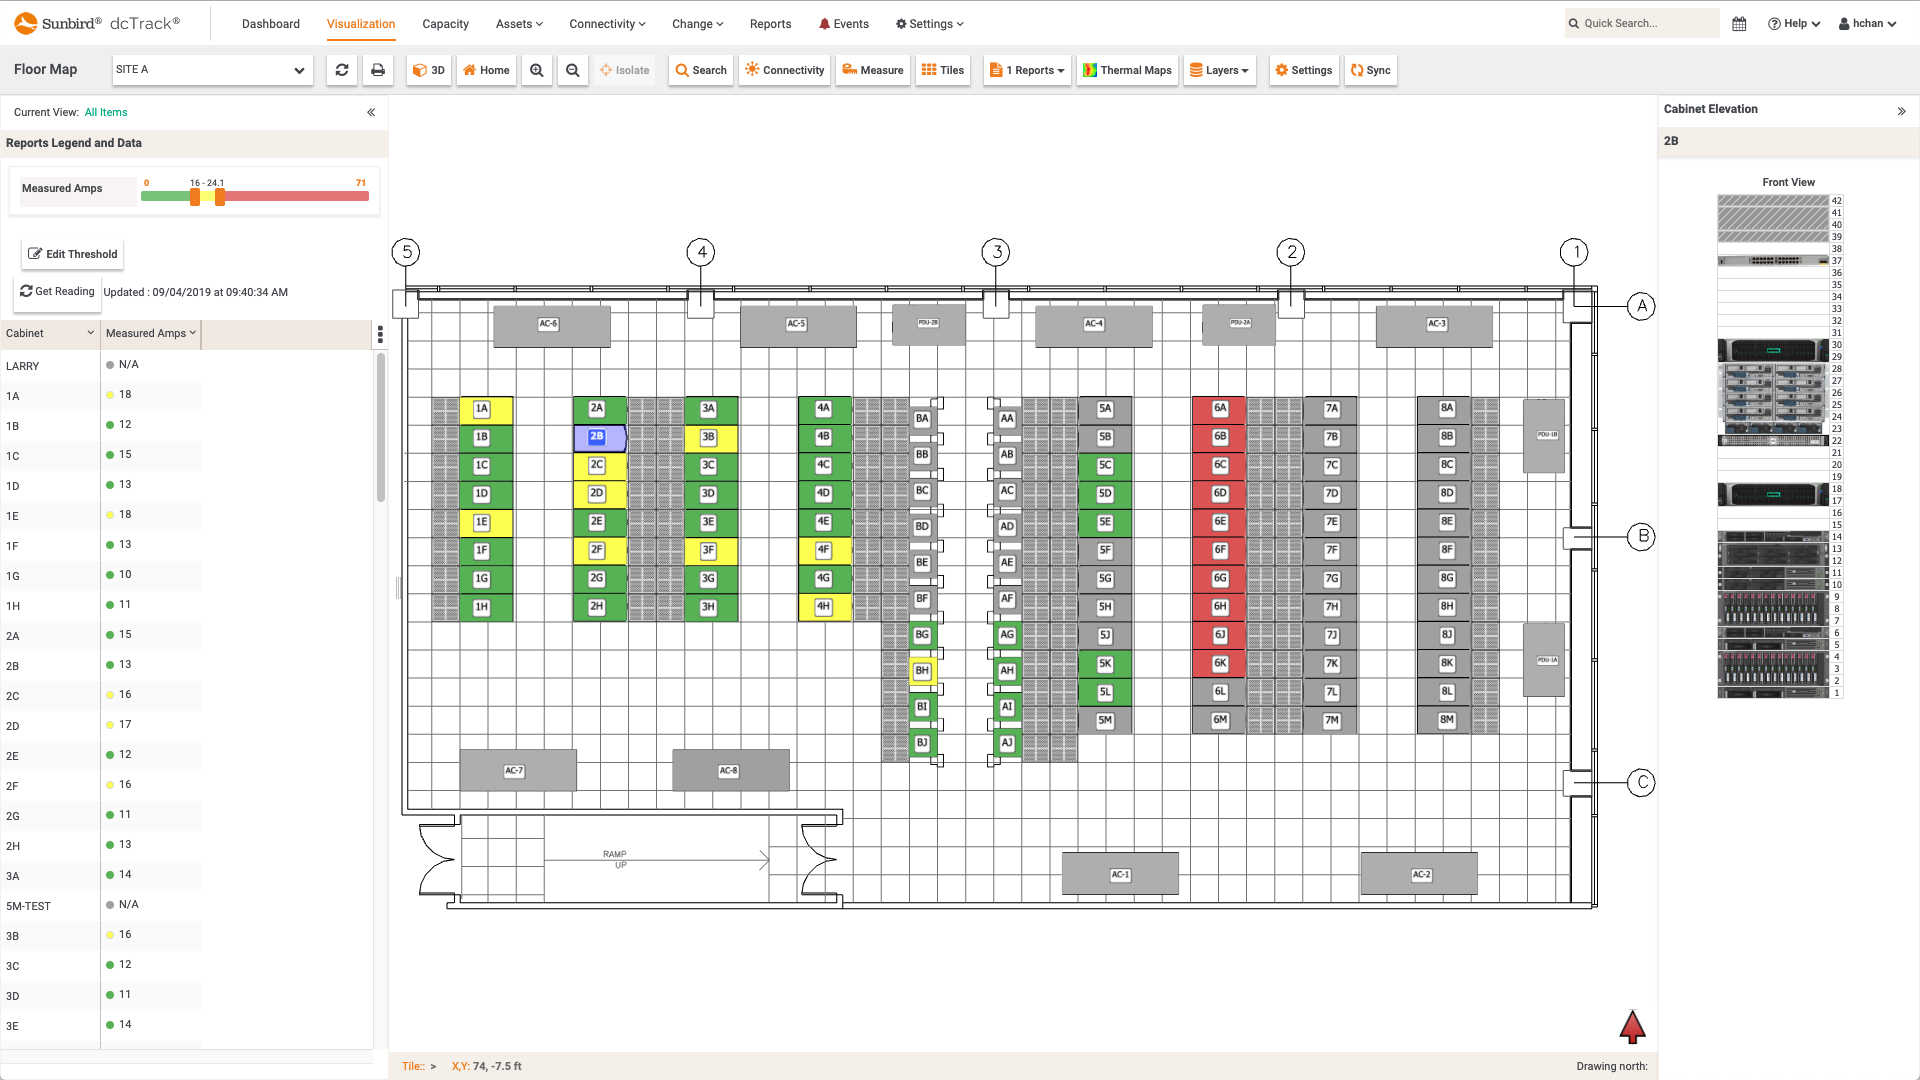
    The Measured Amps per Cabinet floor map report displays the actual Amps across all input cords for all rack PDUs in a cabinet.

    dcTrack DCIM Operations | Power Management | BI & Data Analytics | Visualization
    Measured Amps per Cabinet Floor Map Report
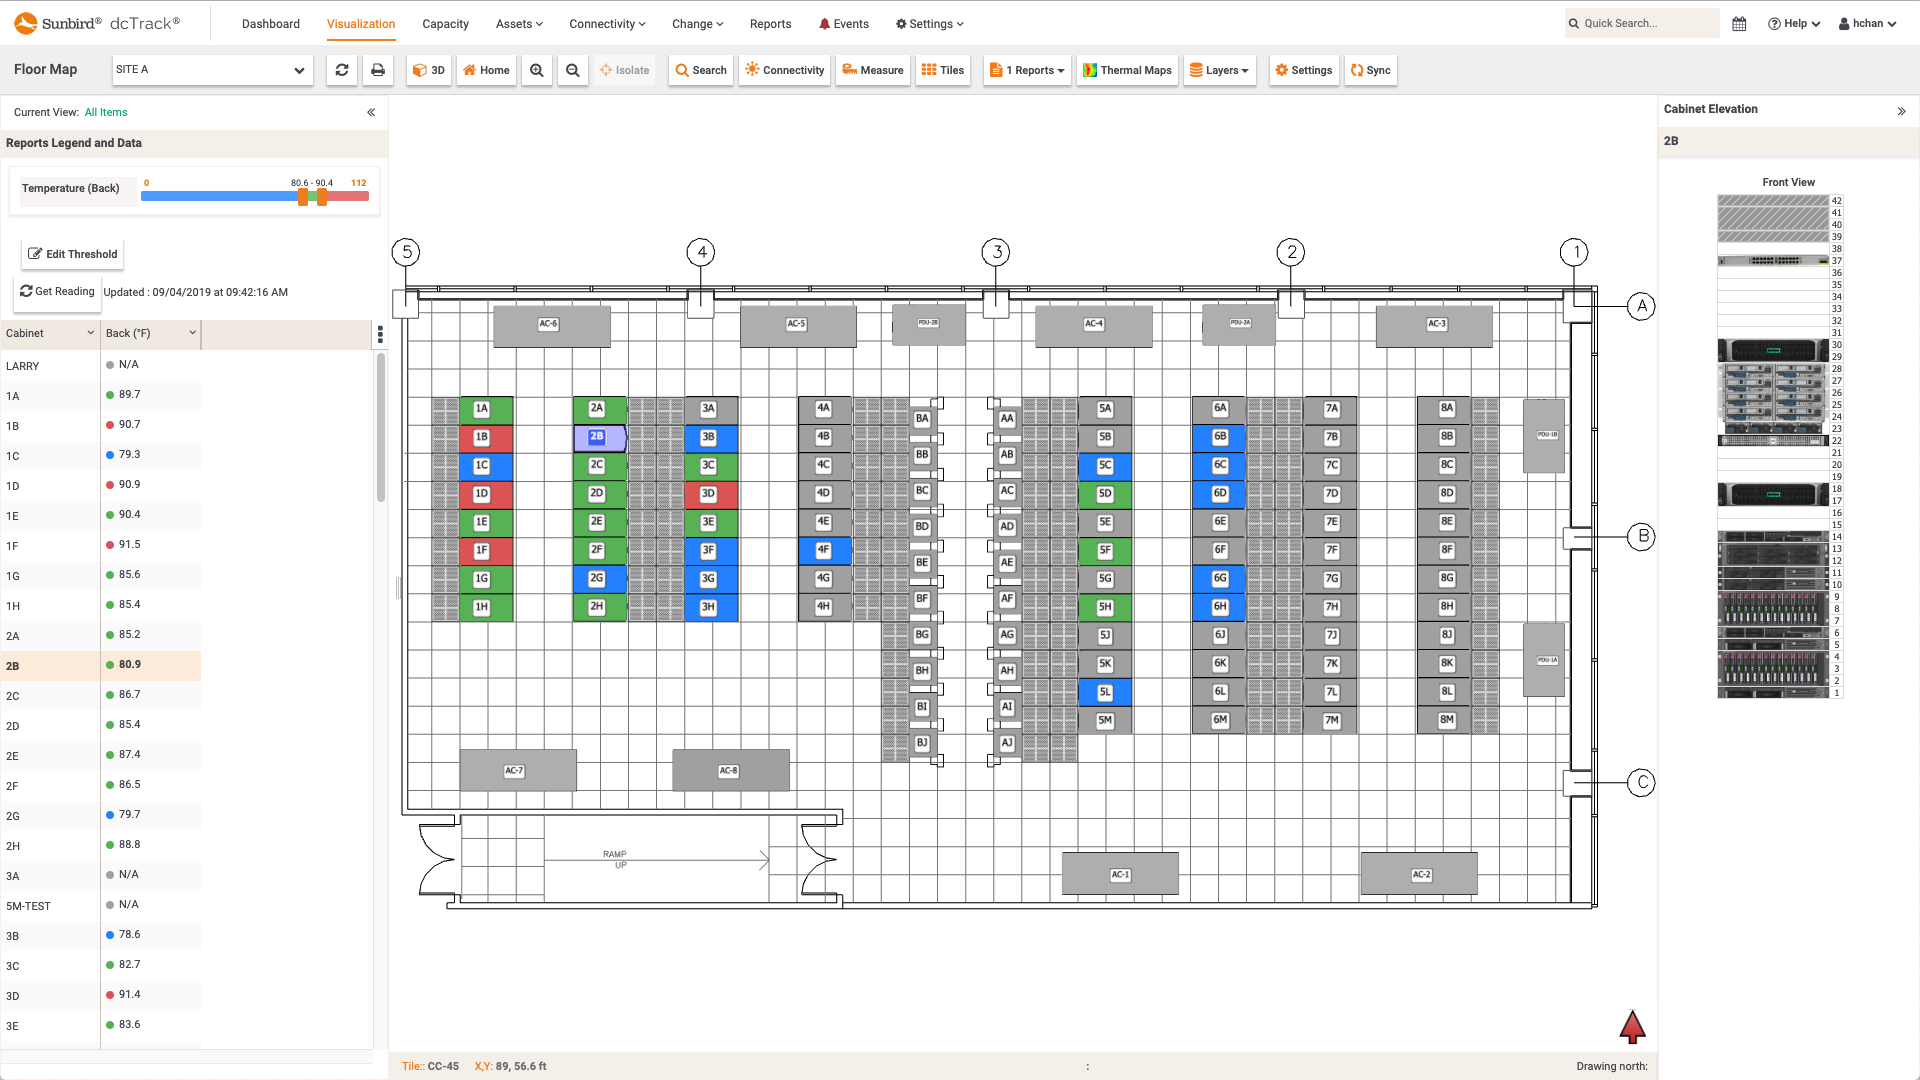
  • Screenshot of Max Temperature per Cabinet (Rear) Floor Map Report
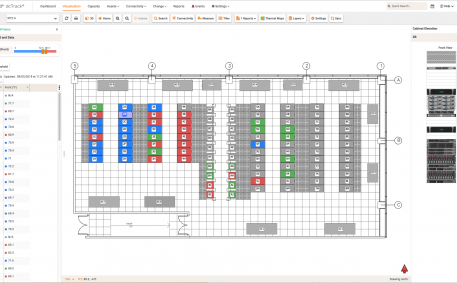
    Screenshot of Max Temperature per Cabinet (Rear) Floor Map Report
    Max Temperature per Cabinet (Rear) Floor Map Report

    The Max Temperature per Cabinet Rears floor map report displays the maximum of all temperature sensors at the rear of a cabinet. 

    dcTrack DCIM Operations | Environment Management | BI & Data Analytics | Visualization
    Max Temperature per Cabinet (Rear) Floor Map Report
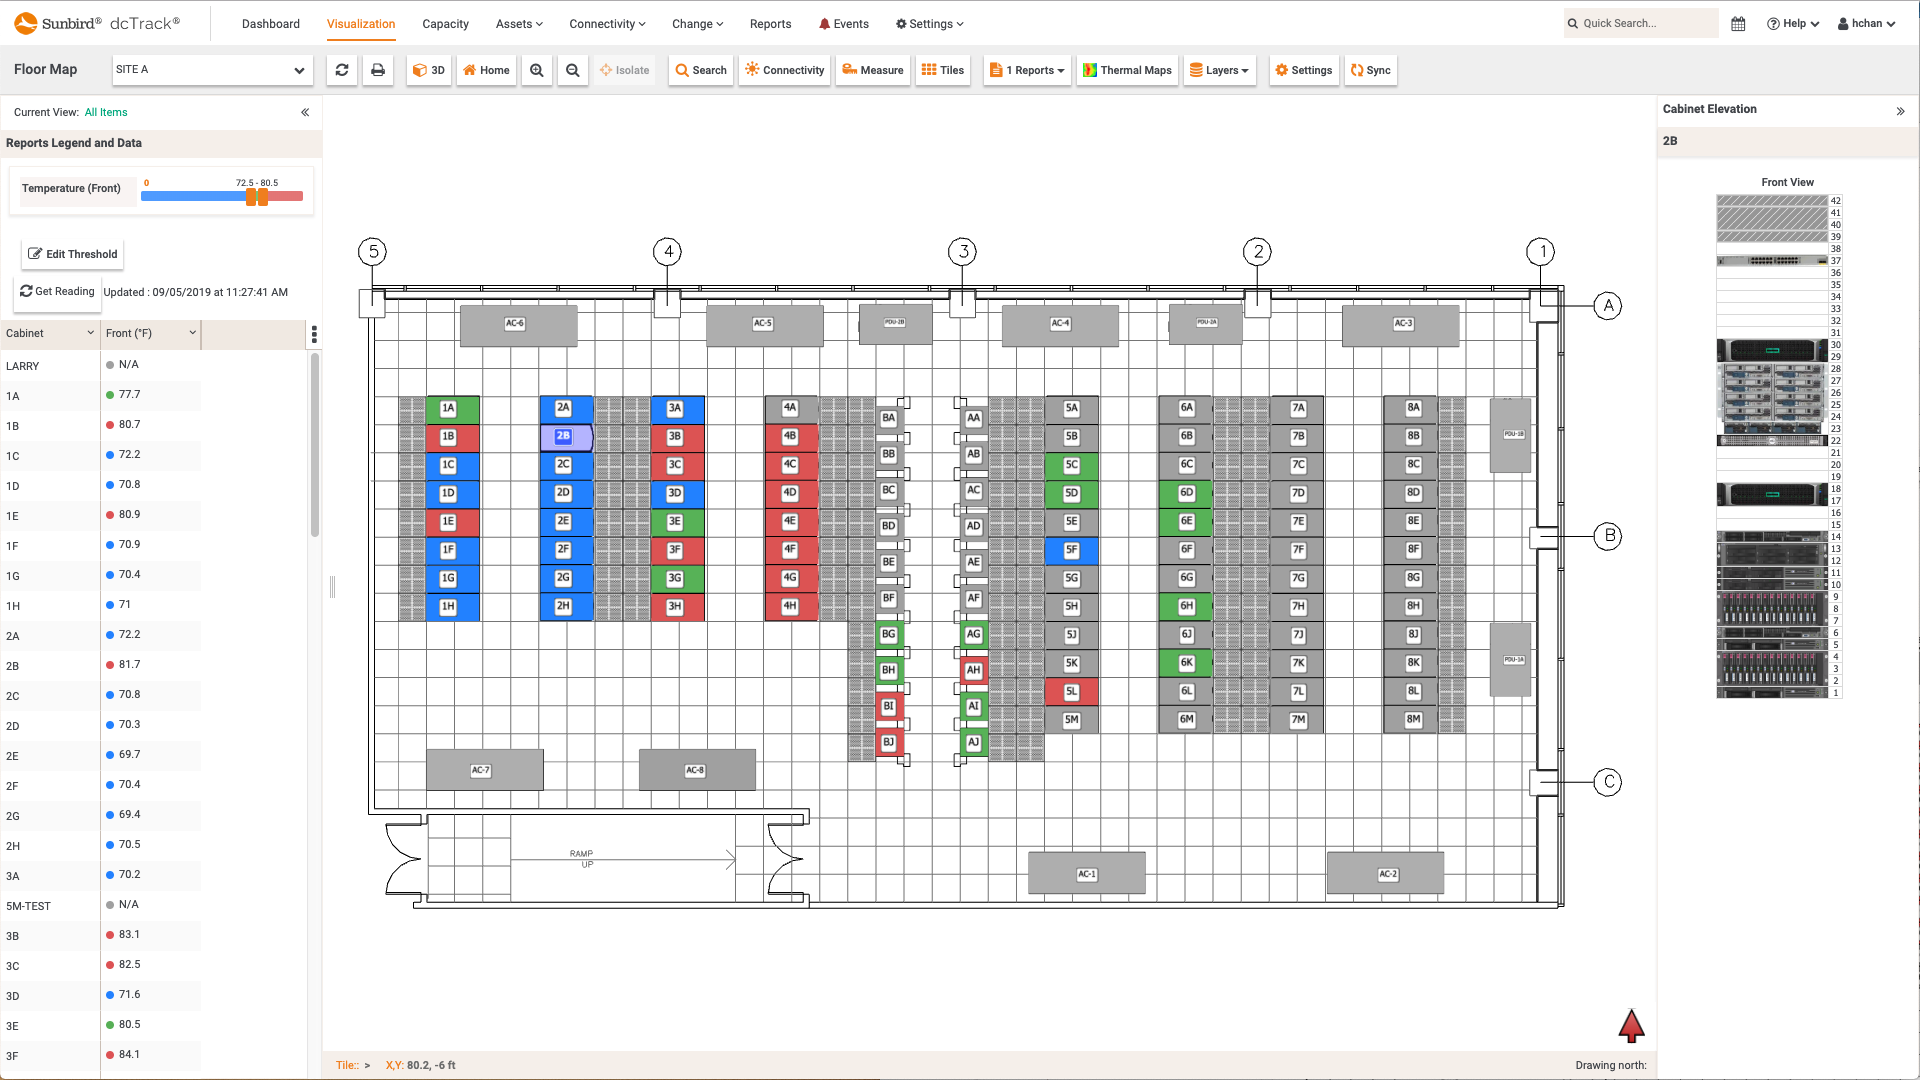
  • Temperature (Front) per Cabinet Floor Map Report
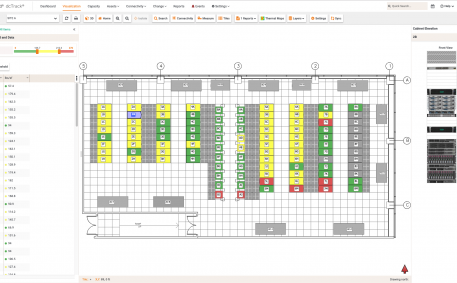
    Temperature (Front) per Cabinet Floor Map Report
    Temperature (Front) per Cabinet Floor Map Report

    The Max Temperature per Cabinet Fronts floor map report displays the maximum of all temperature sensors at the front of the cabinet.

    dcTrack DCIM Operations | Environment Management | BI & Data Analytics | Visualization
    Temperature (Front) per Cabinet Floor Map Report
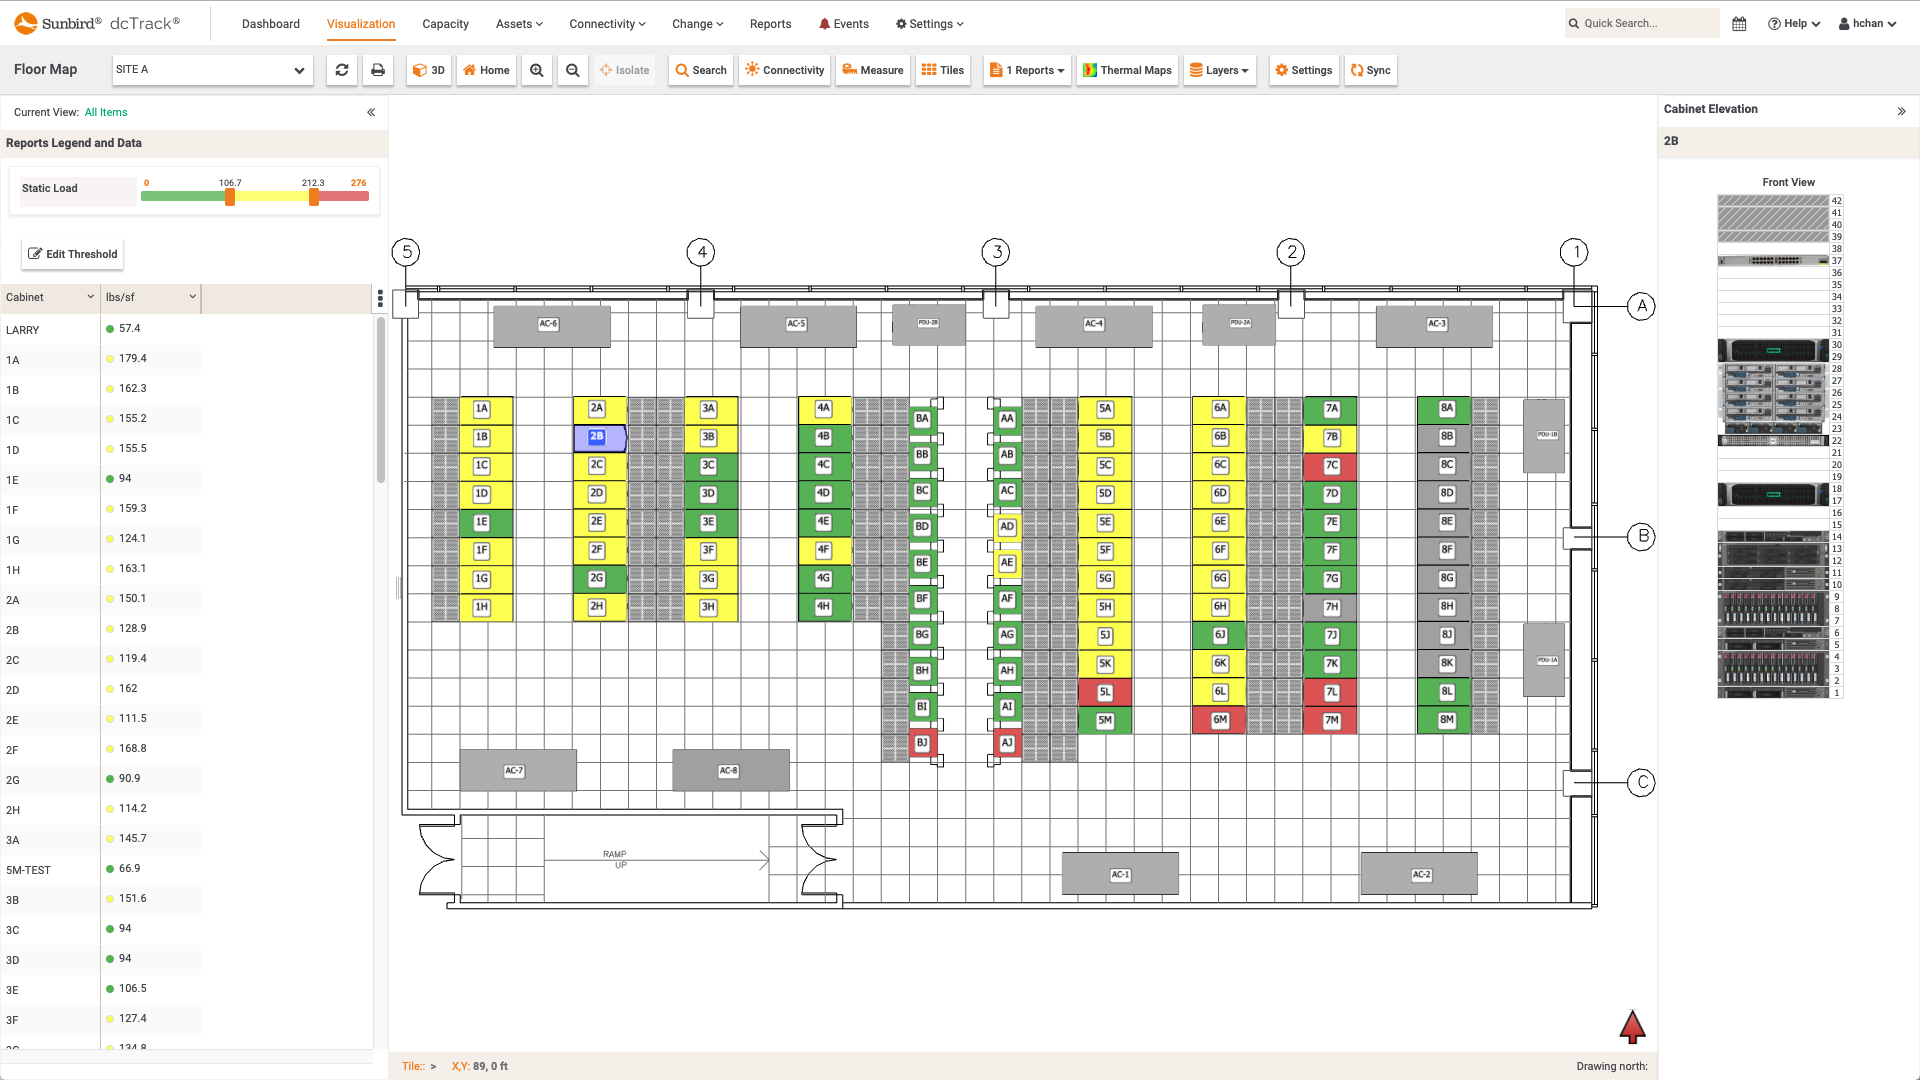
  • Screenshot of Static Load per Cabinet Floor Map Report
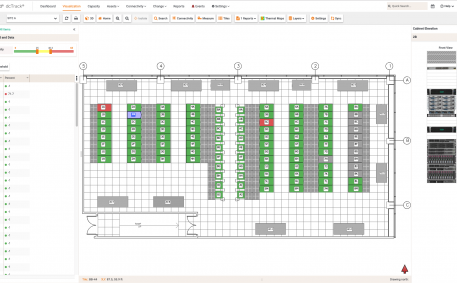
    Screenshot of Static Load per Cabinet Floor Map Report
    Static Load per Cabinet Floor Map Report

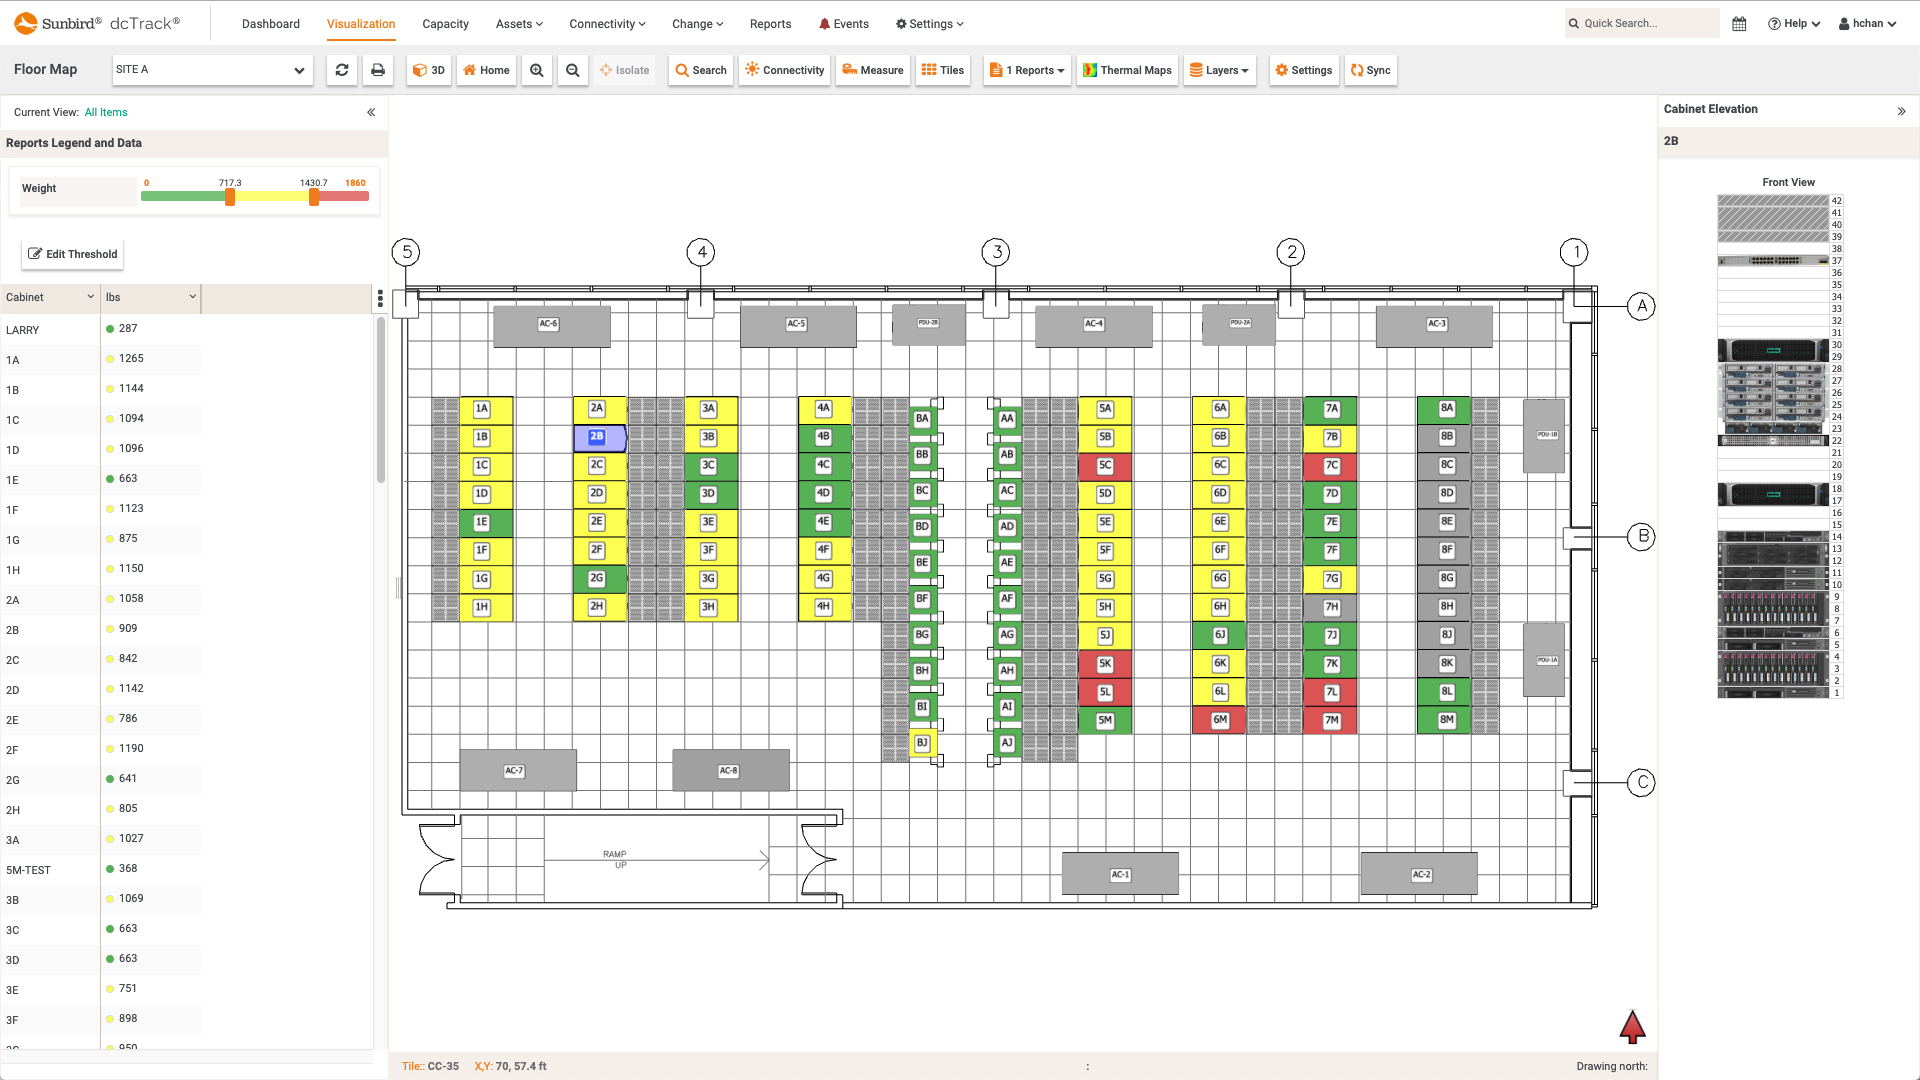
    The Static Load per Cabinet floor map report displays the weight per cabinet divided by the cabinet footprint area.

    dcTrack DCIM Operations | Capacity Management | BI & Data Analytics | Visualization
    Static Load per Cabinet Floor Map Report
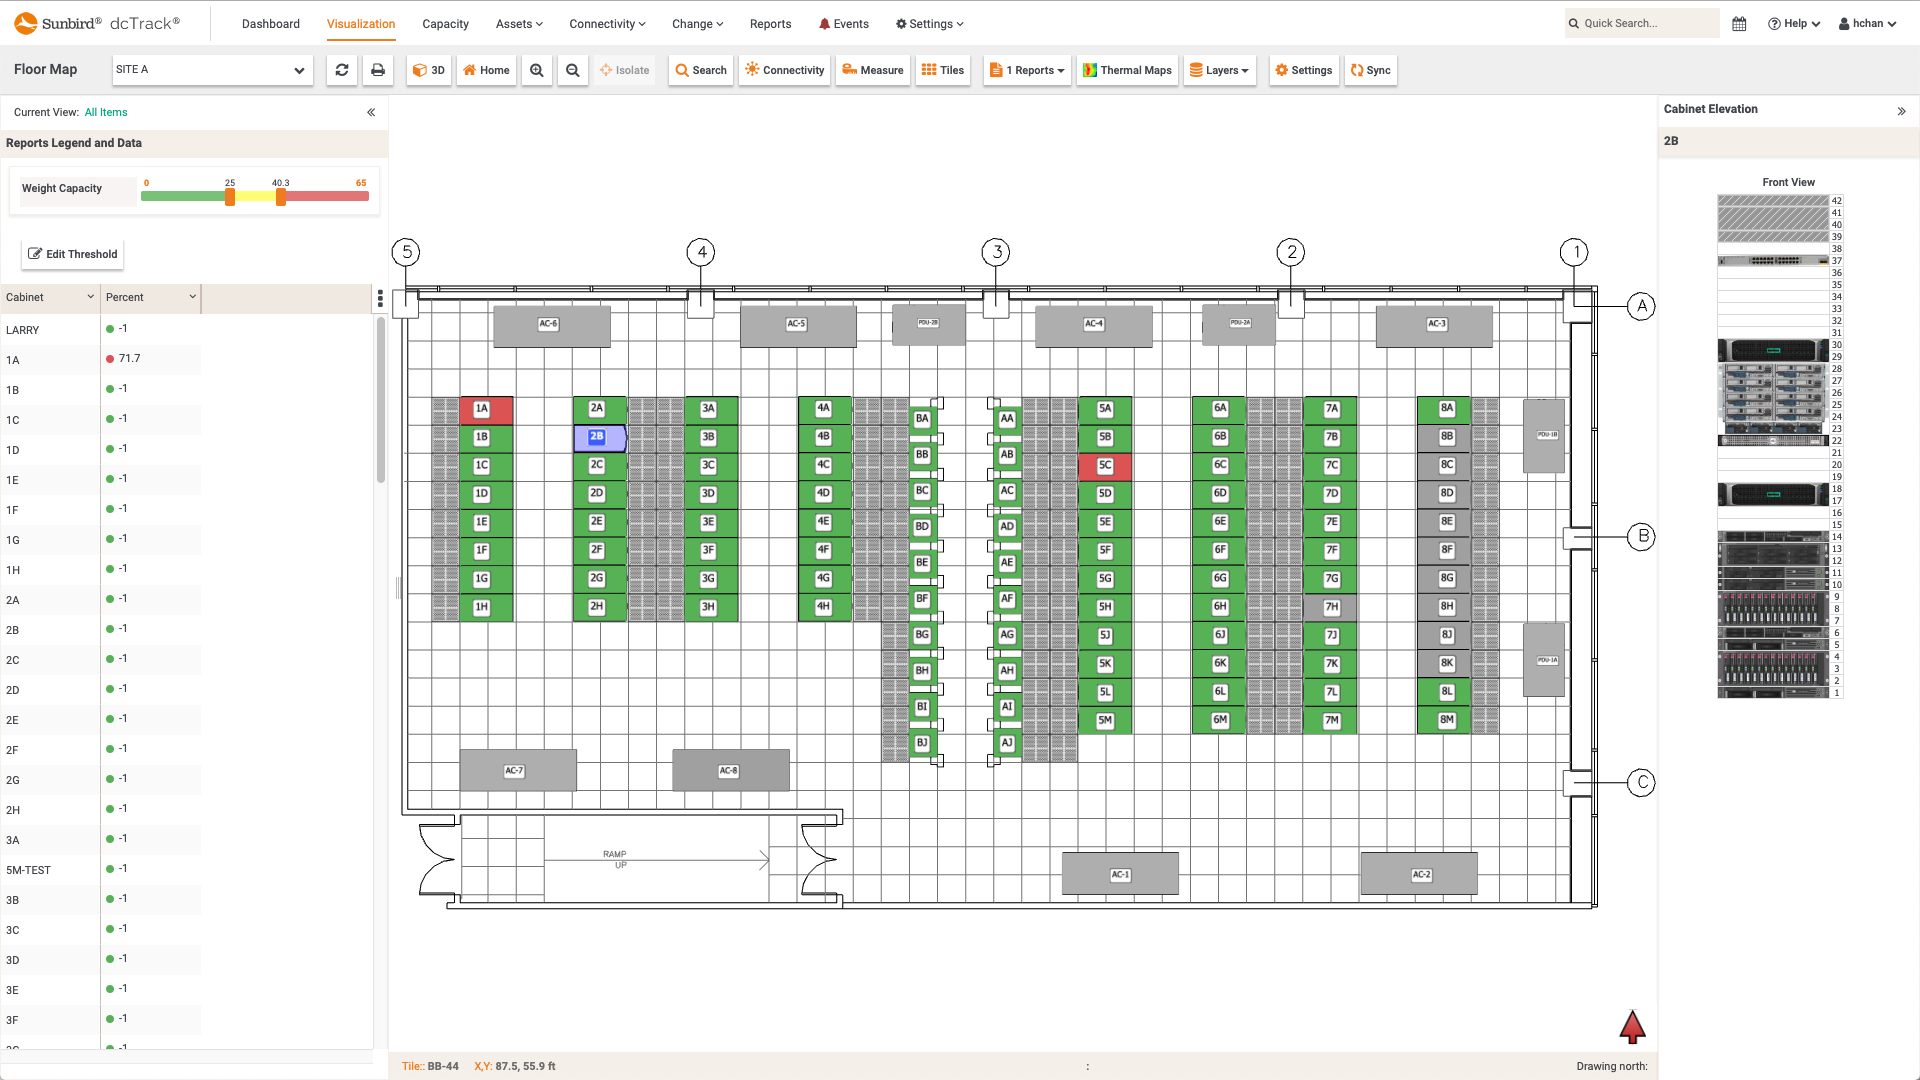
  • Screenshot of Weight Capacity per Cabinet Floor Map Report
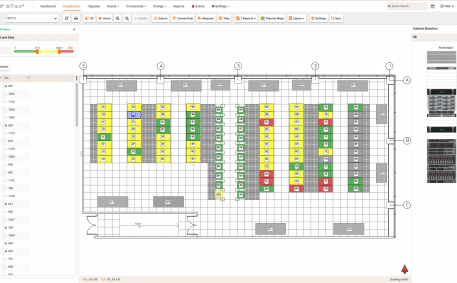
    Screenshot of Weight Capacity per Cabinet Floor Map Report
    Weight Capacity per Cabinet Floor Map Report

    The Weight Capacity per Cabinet floor map report displays the weight capacity per cabinet based on the load capacity for that cabinet.

    dcTrack DCIM Operations | Capacity Management | BI & Data Analytics | Visualization
    Weight Capacity per Cabinet Floor Map Report
  • Screenshot of Weight per Cabinet Floor Map Report
    Screenshot of Weight per Cabinet Floor Map Report
    Weight per Cabinet Floor Map Report

    The Weight per Cabinet floor map report displays the total weight of all of the items in the cabinet plus the cabinet weight.

    dcTrack DCIM Operations | Capacity Management | BI & Data Analytics | Visualization
    Weight per Cabinet Floor Map Report
  • Screenshot of Percent Full per Cabinet Floor Map Report
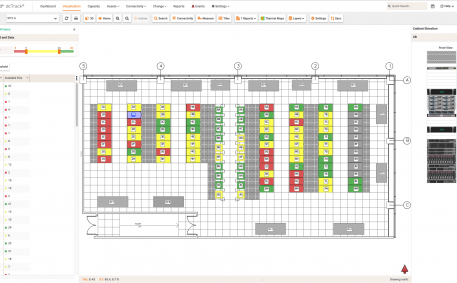
    Screenshot of Percent Full per Cabinet Floor Map Report
    Percent Full per Cabinet Floor Map Report

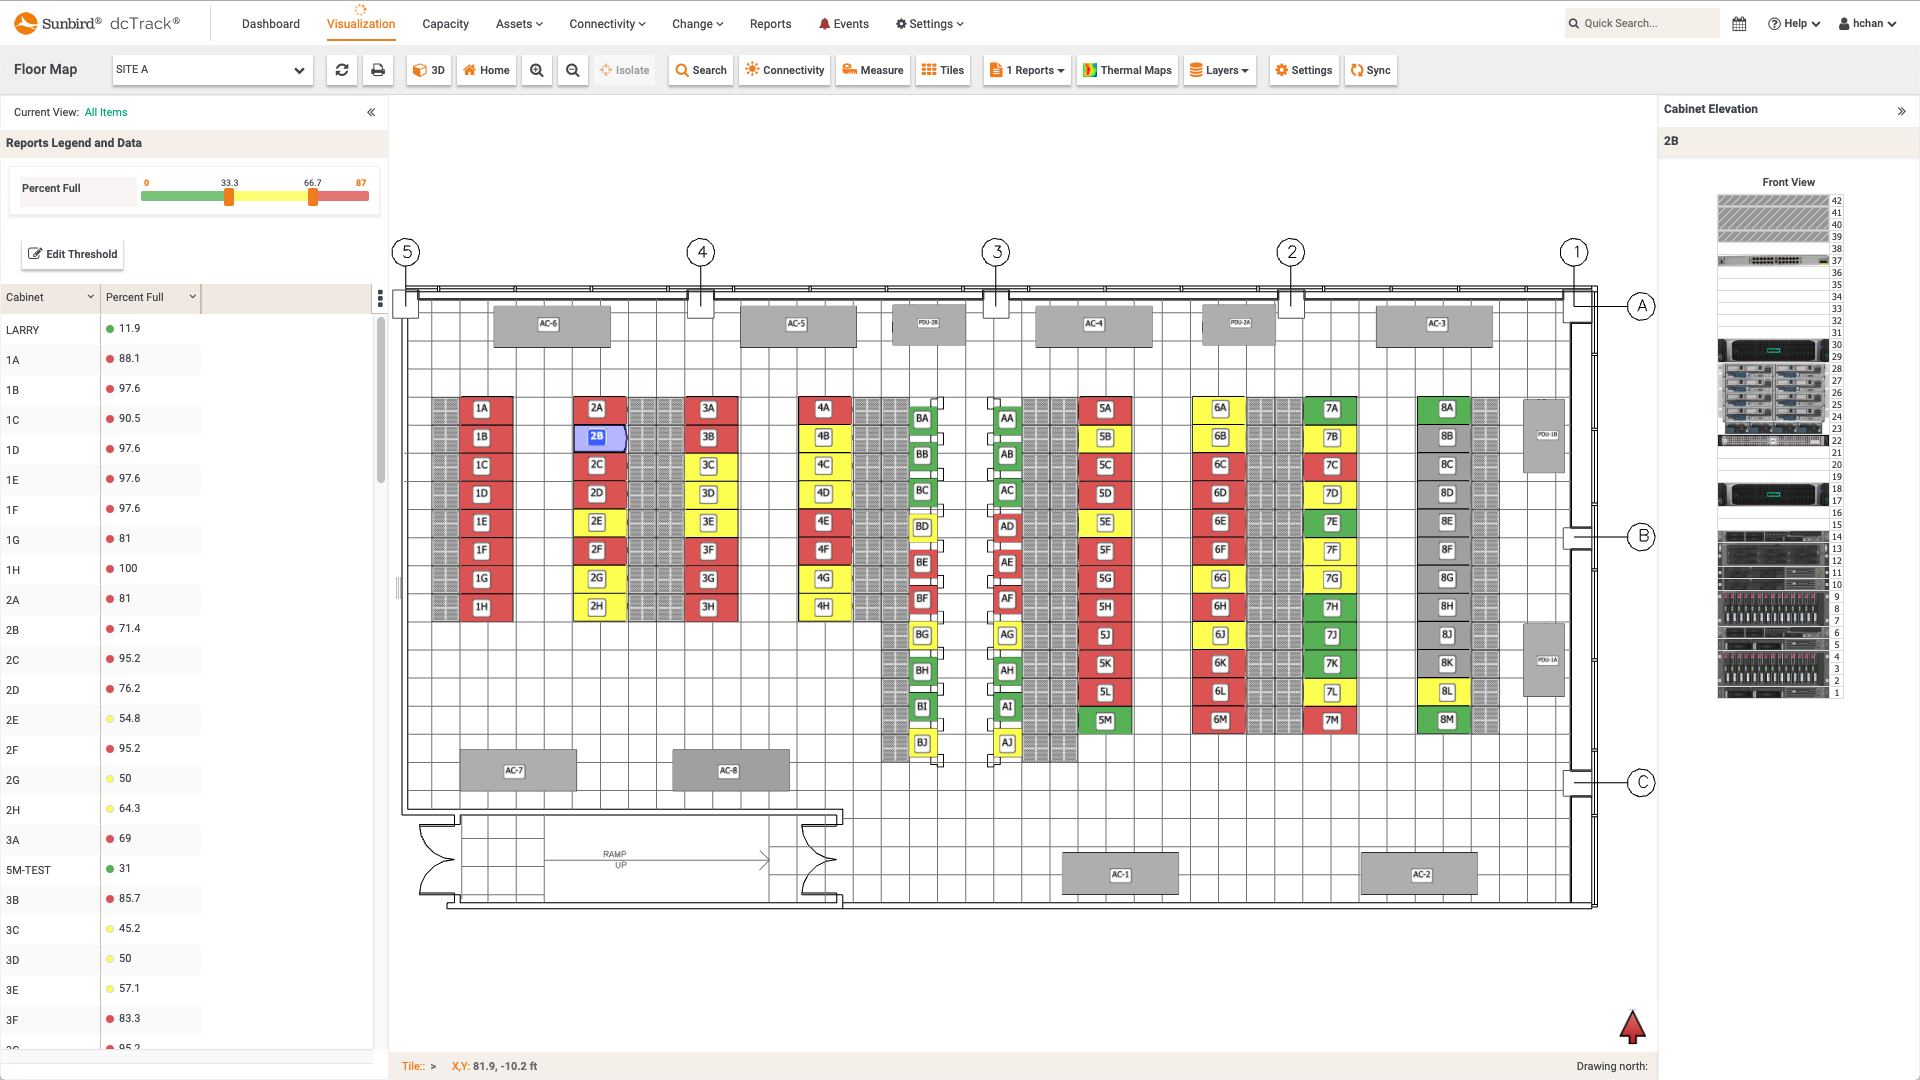
    The Percent Full per Cabinet floor map report displays the percent full per cabinet (either front or back rails occupied).

    dcTrack DCIM Operations | Capacity Management | BI & Data Analytics | Visualization
    Percent Full per Cabinet Floor Map Report
  • Screenshot of Available RUs per Cabinet Floor Map Report
    Screenshot of Available RUs per Cabinet Floor Map Report
    Available RUs per Cabinet Floor Map Report

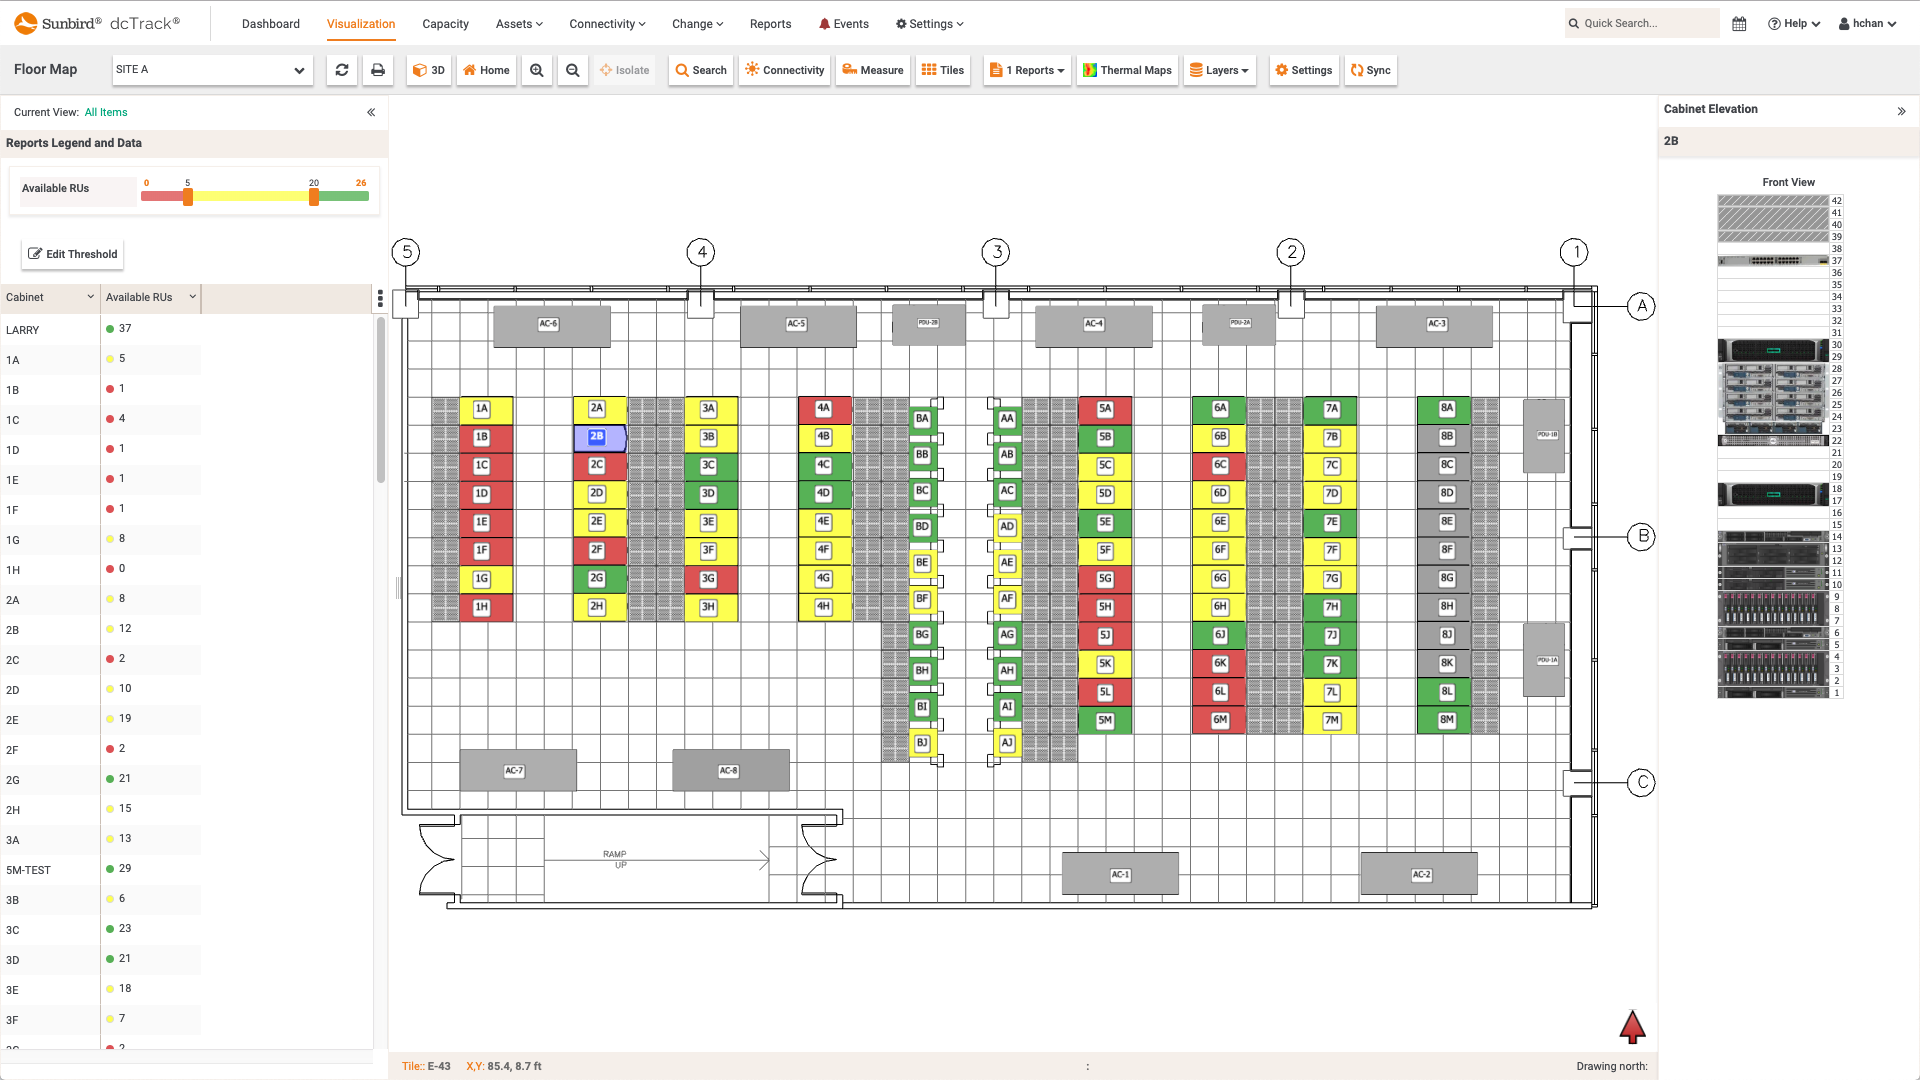
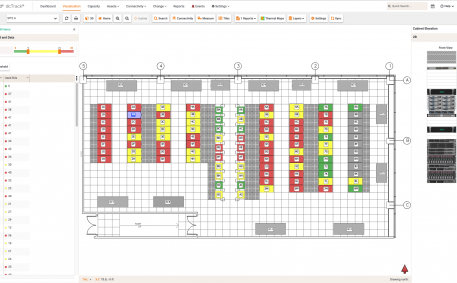
    The Available RUs per Cabinet floor map report displays the total number of available rack units (front and back) out of the total number of rack units in the cabinet.

    dcTrack DCIM Operations | Capacity Management | BI & Data Analytics | Visualization
    Available RUs per Cabinet Floor Map Report
  • Screenshot of Used RUs per Cabinet Floor Map Report
    Screenshot of Used RUs per Cabinet Floor Map Report
    Used RUs per Cabinet Floor Map Report

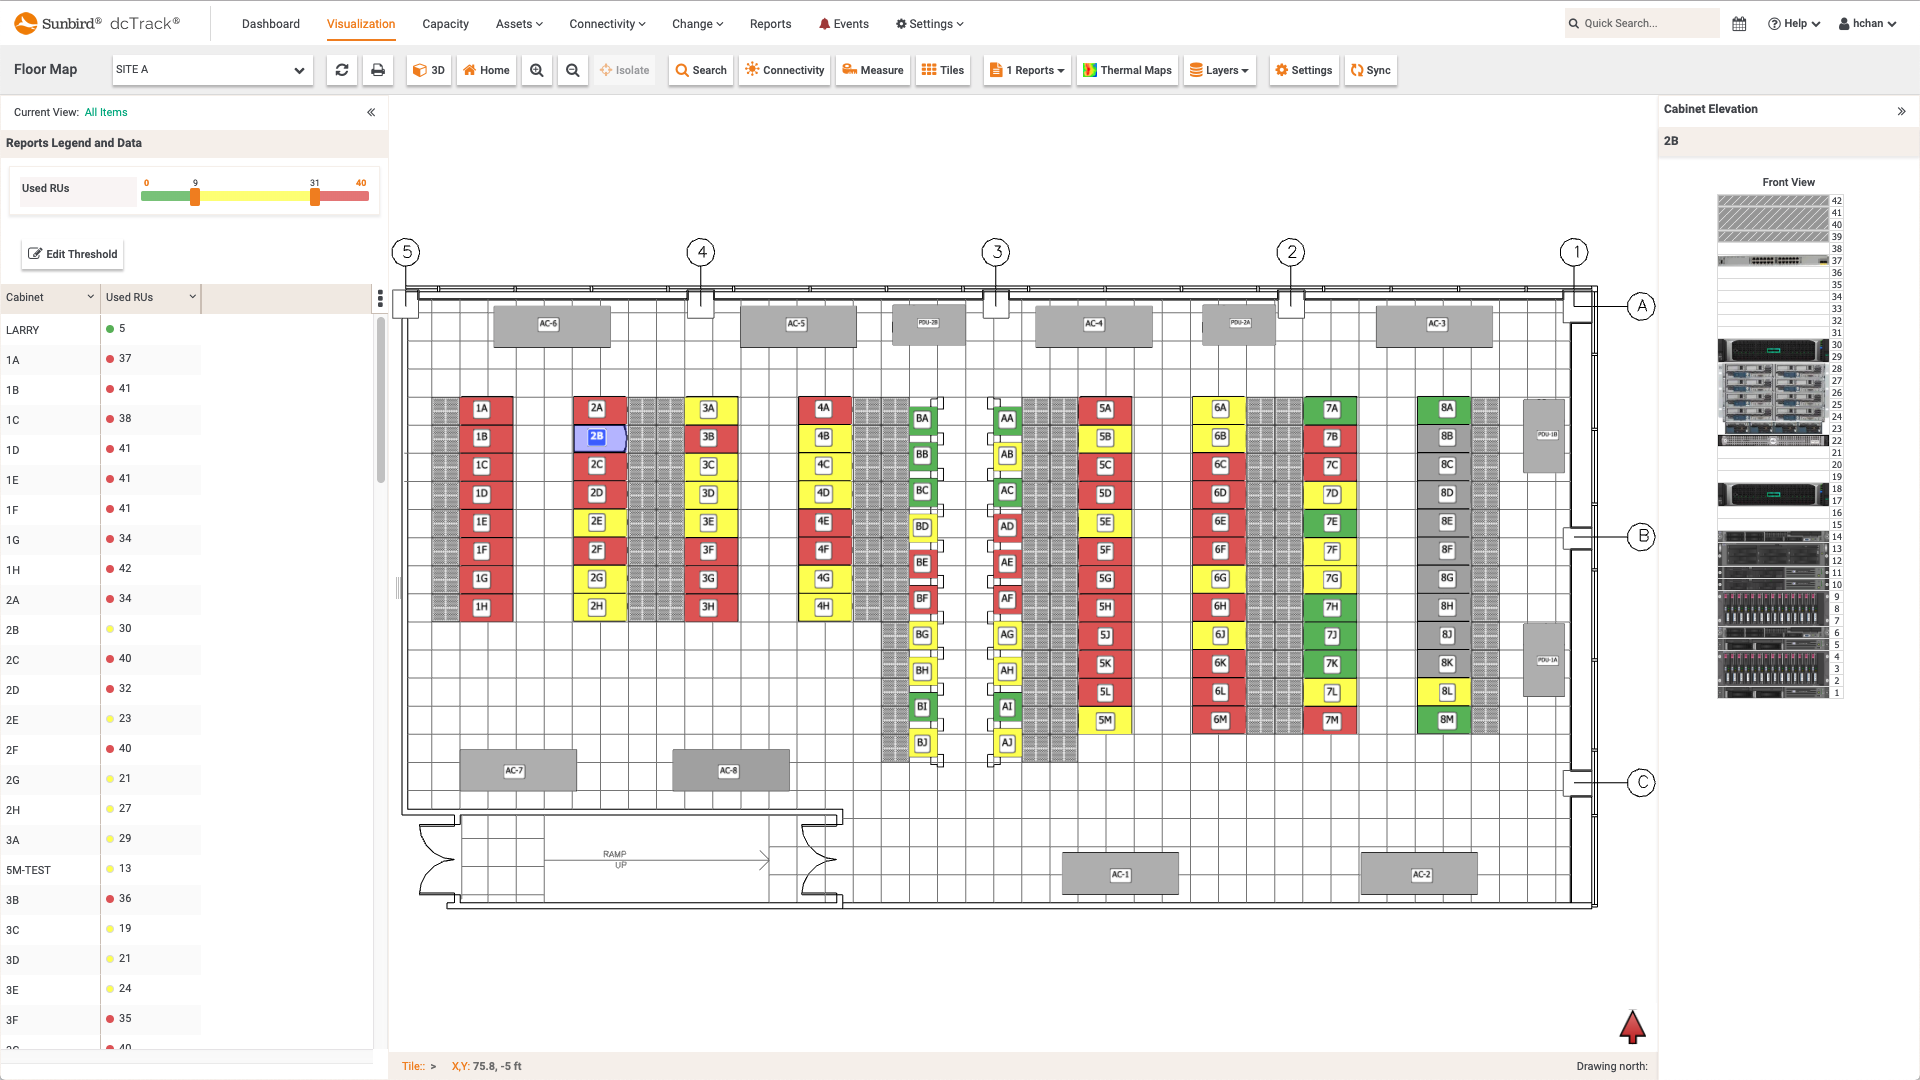
    The Used RUs per Cabinet floor map report displays the total number of used rack units (front and back) out of the total number of rack units in the cabinet.

    dcTrack DCIM Operations | Capacity Management | BI & Data Analytics | Visualization
    Used RUs per Cabinet Floor Map Report
  • Screenshot of Adding SQL Query Report Widget
    Screenshot of Adding SQL Query Report Widget
    Adding SQL Query Report Widget

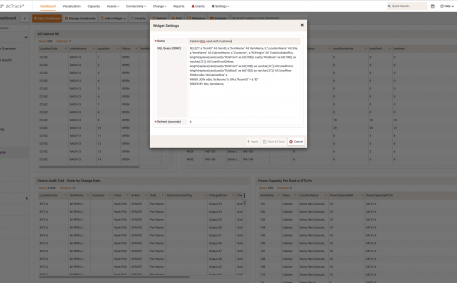
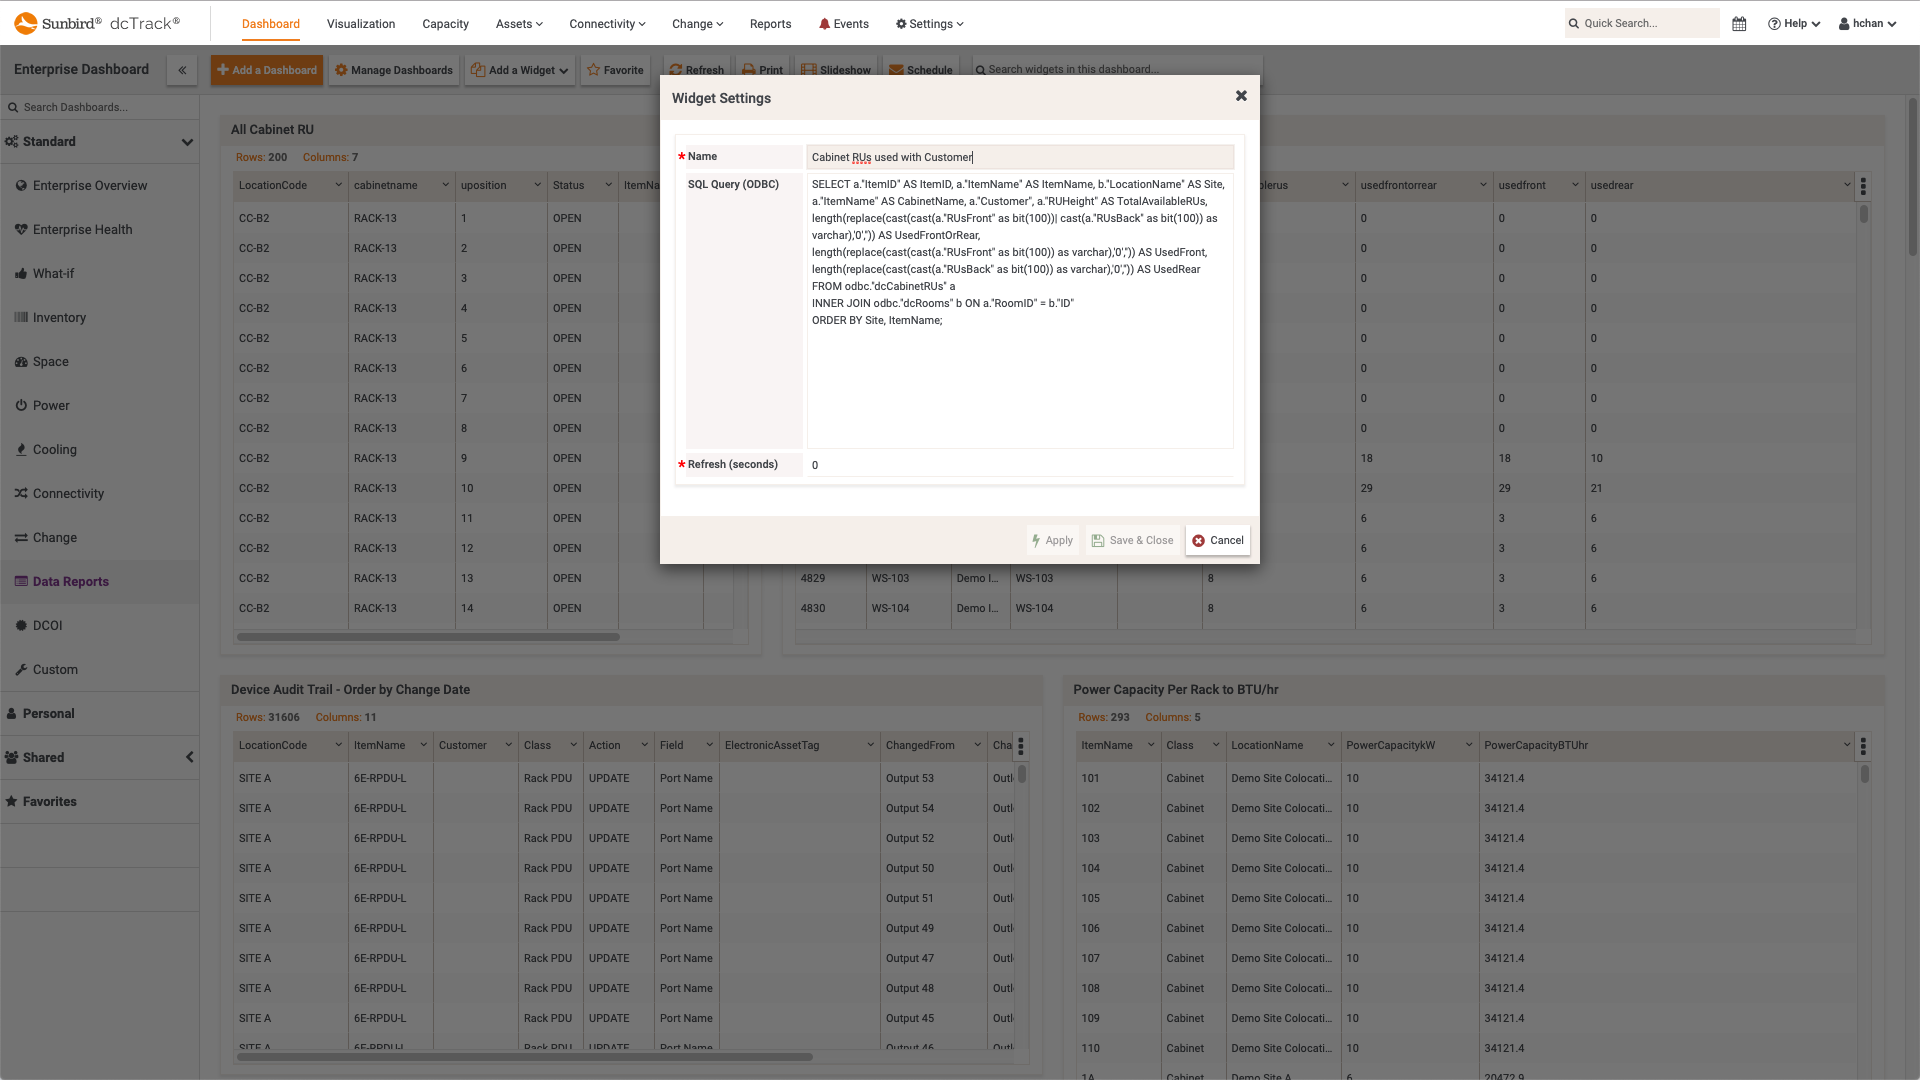
    With SQL widgets, you can get the exact data you want via SQL queries and ODBC table views, or simply let Sunbird's Professional Services team know what you're looking for, and we'll create the widget for you.

    dcTrack DCIM Operations | BI & Data Analytics
    Adding SQL Query Report Widget
  • Screenshot of Dashboard Widget Drill Down Report
    Screenshot of Dashboard Widget Drill Down Report
    Dashboard Widget Drill Down Report

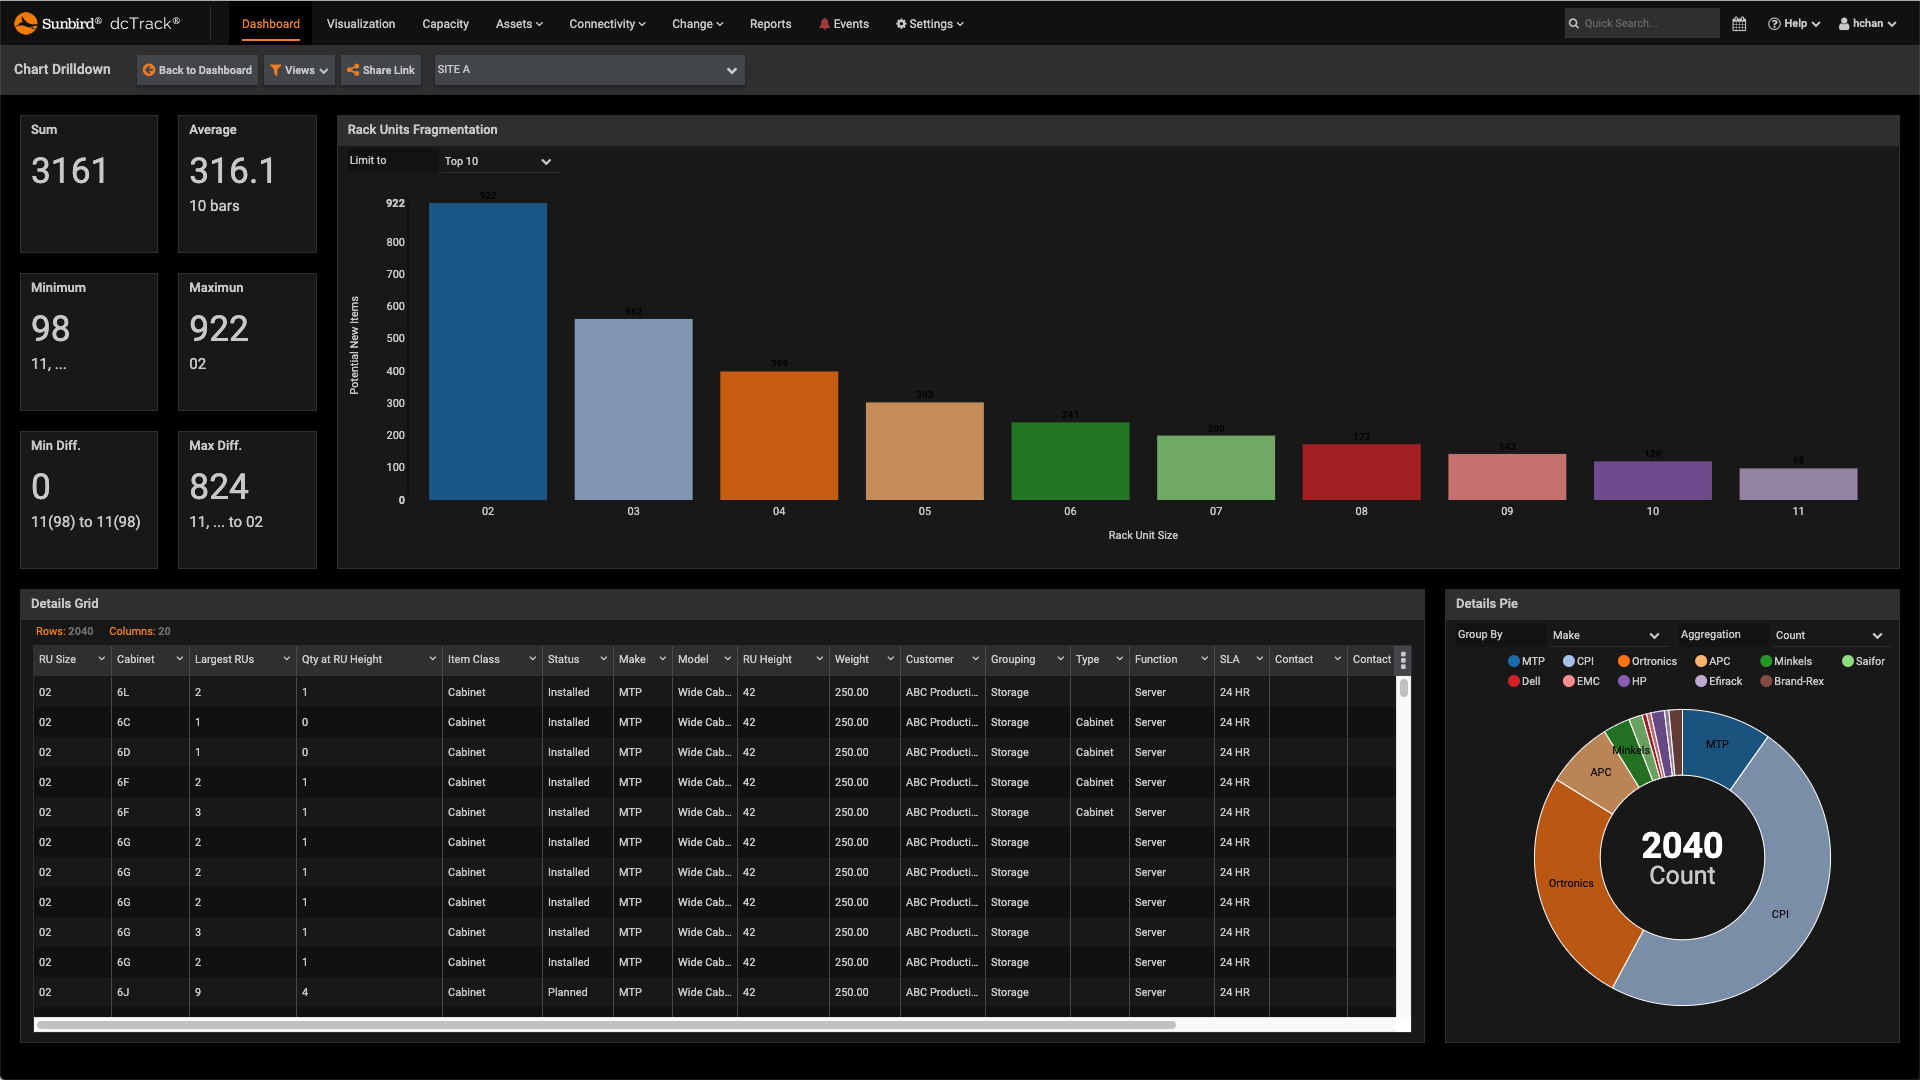
    See the raw data behind the chart with the widget drilldown feature. A single click takes you to a view with the original chart widget, a summary of the data, and the raw data in tabular form.

    dcTrack DCIM Operations | BI & Data Analytics | Dashboards
    Dashboard Widget Drill Down Report
  • Screenshot of DCOI Dashboard
    Screenshot of DCOI Dashboard
    DCOI Dashboard

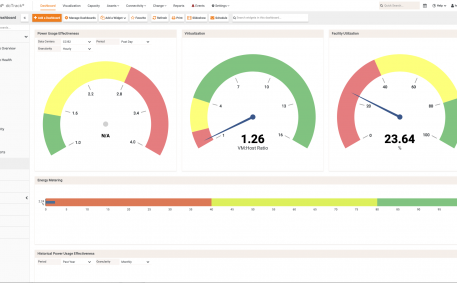
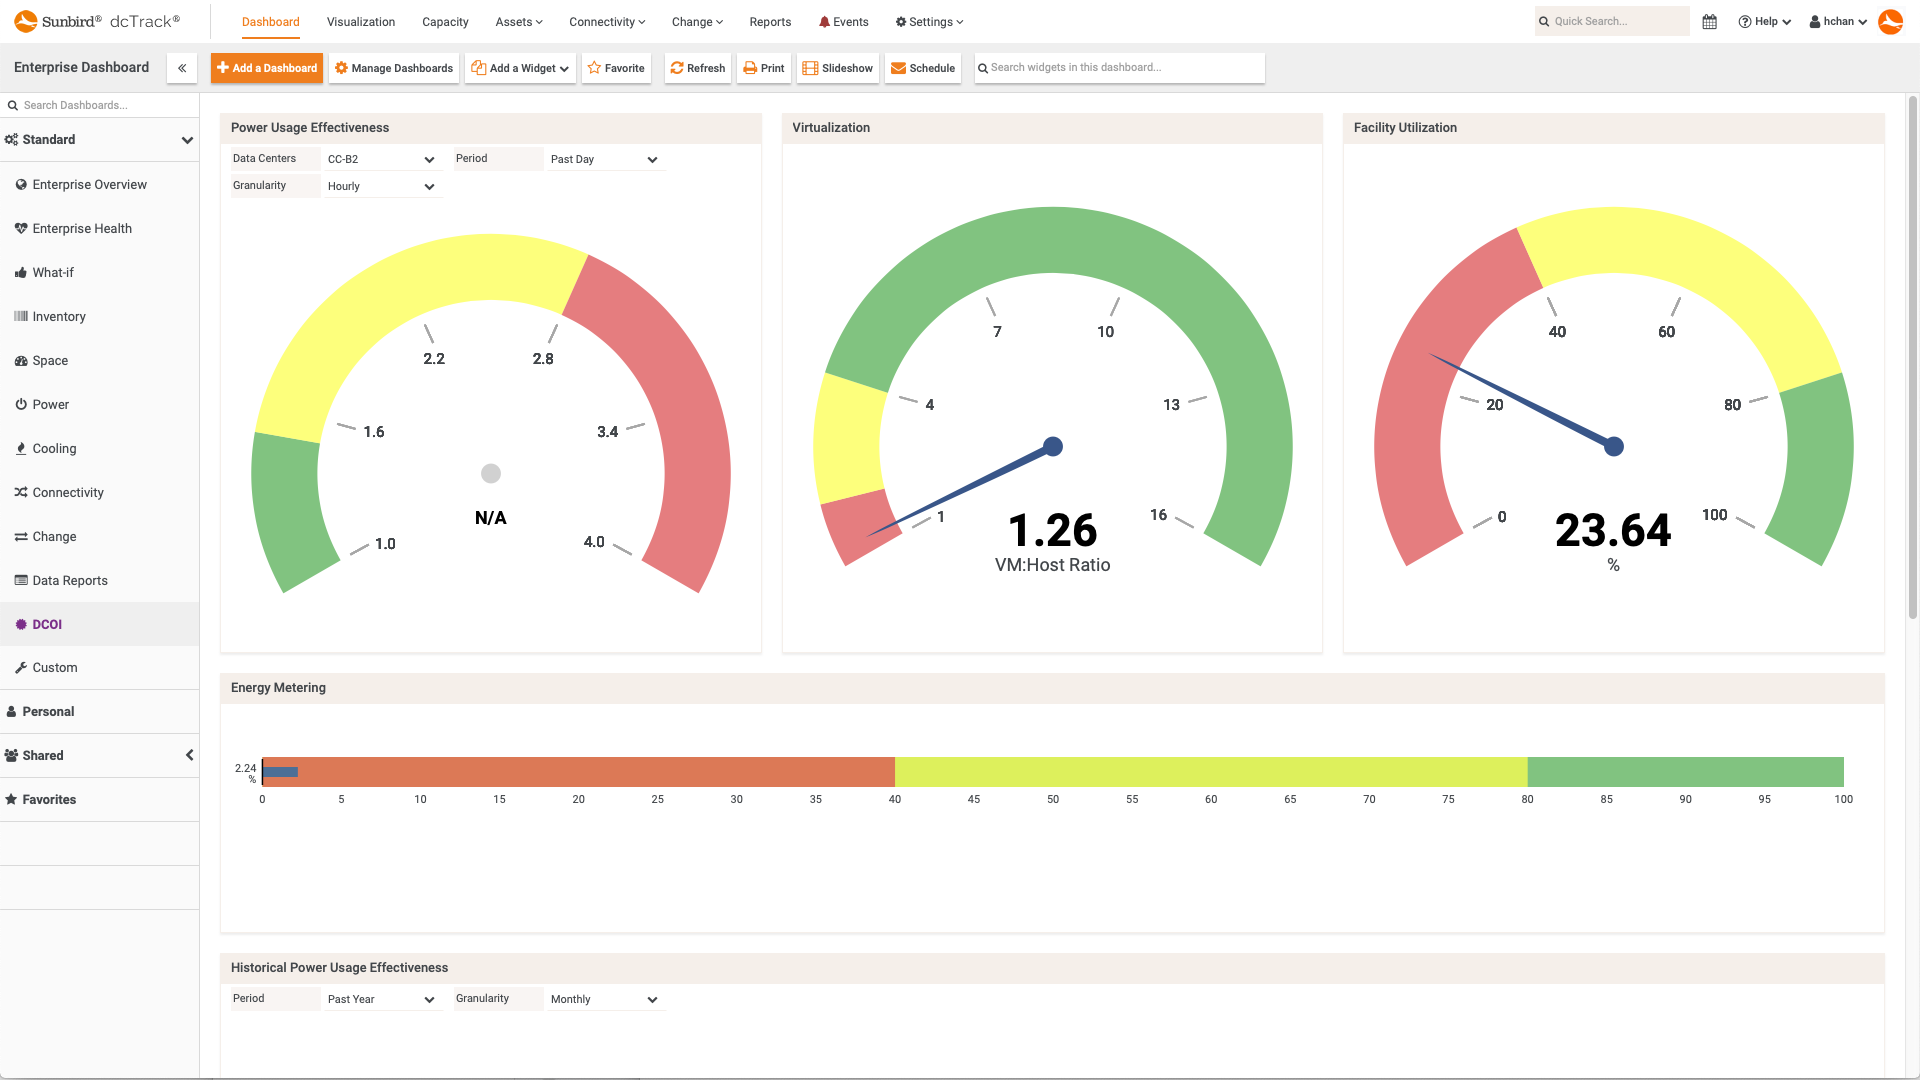
    The DCOI Executive Dashboard provides charts used to measure compliance with the key metrics for the Data Center Optimization Initiative (DCOI) mandate or any efficiency initiative. 

    dcTrack DCIM Operations | BI & Data Analytics | Energy Management | Dashboards
    DCOI Dashboard
  • Screenshot of What If Analysis Dashboard
    Screenshot of What If Analysis Dashboard
    What If Analysis Dashboard

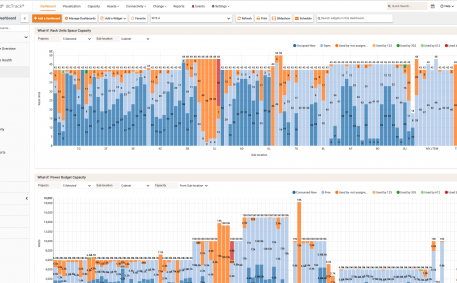
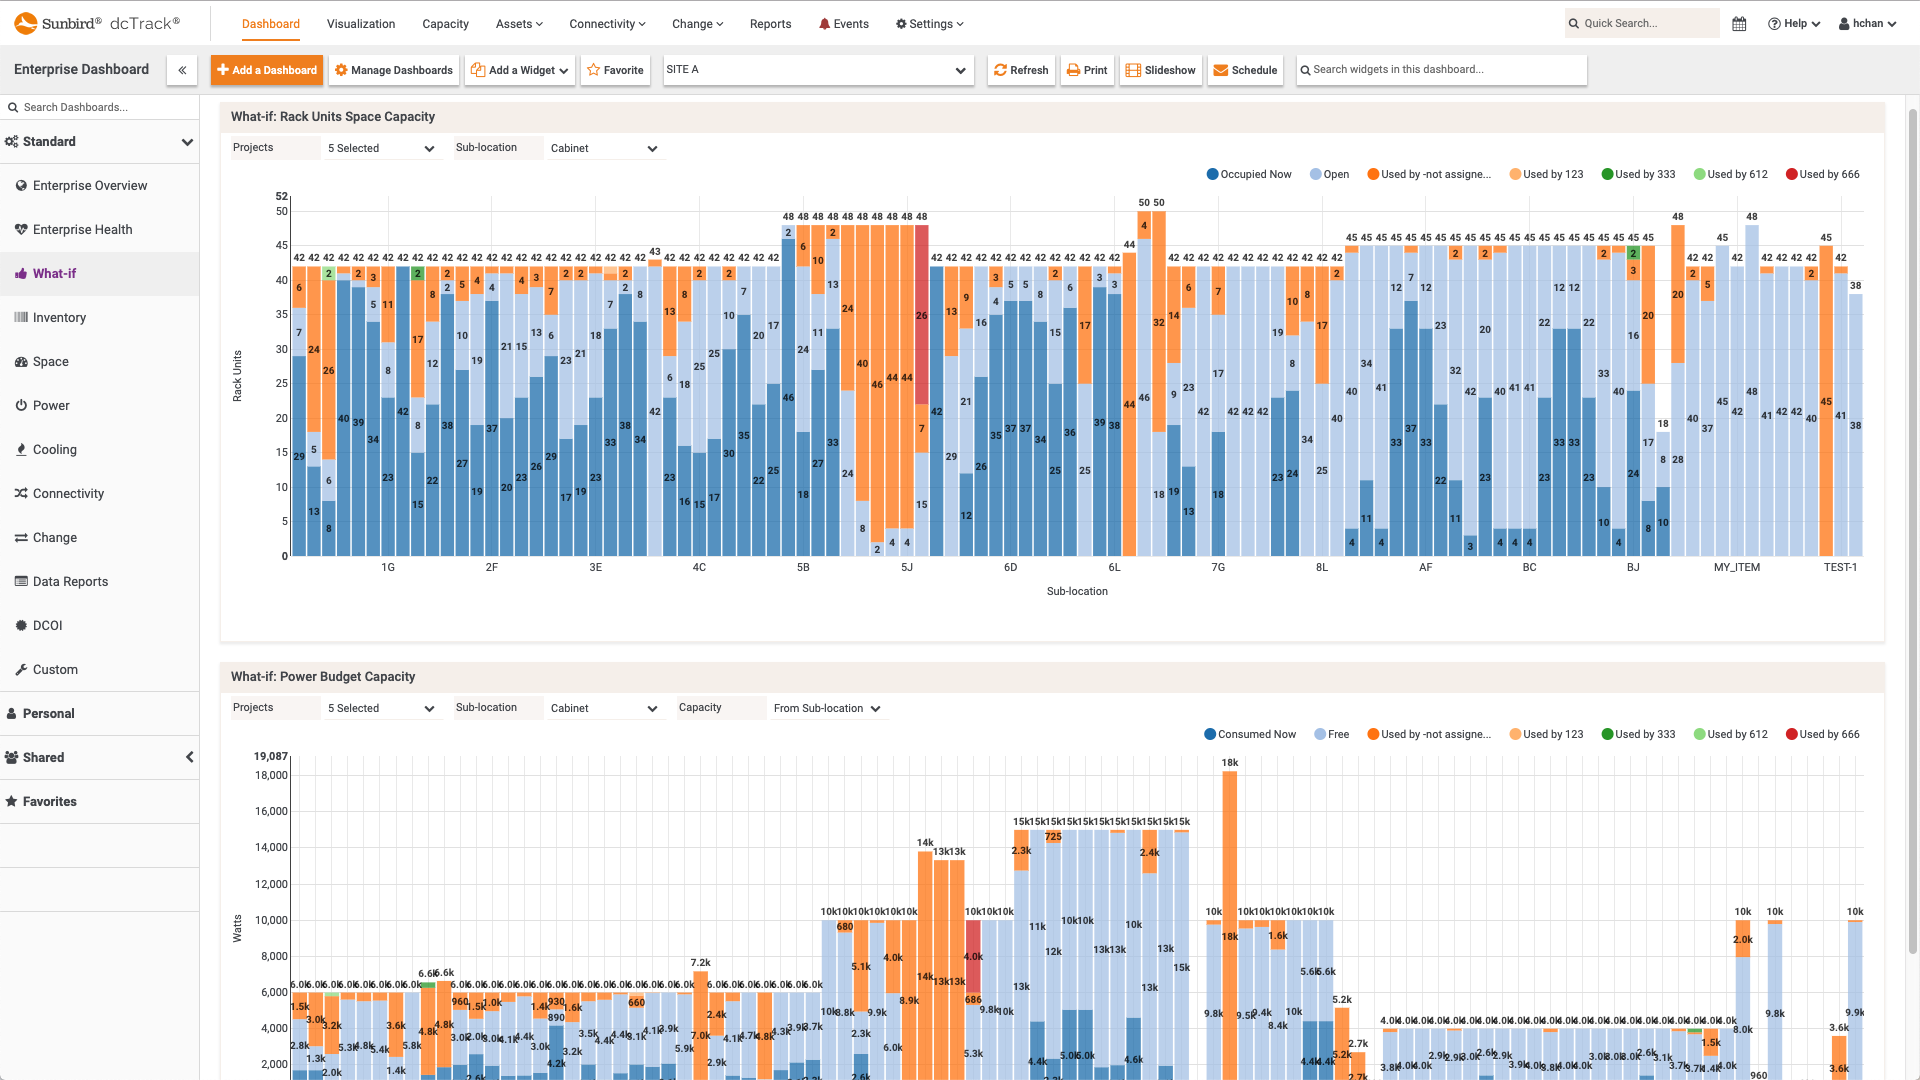
    The What-If Dashboard provides widgets that show the potential impact of a change in your data center on a per-project basis.

    dcTrack DCIM Operations | BI & Data Analytics | Capacity Management | Dashboards
    What If Analysis Dashboard
  • Screenshot of HTML and Web Cam Feeds for Dashboard Widgets
    Screenshot of HTML and Web Cam Feeds for Dashboard Widgets
    HTML and Web Cam Feeds for Dashboard Widgets

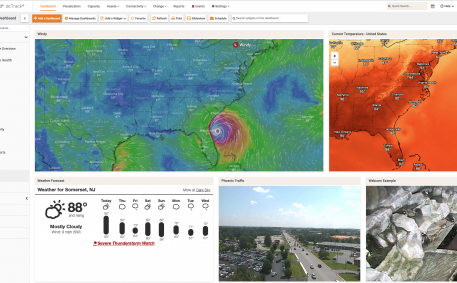
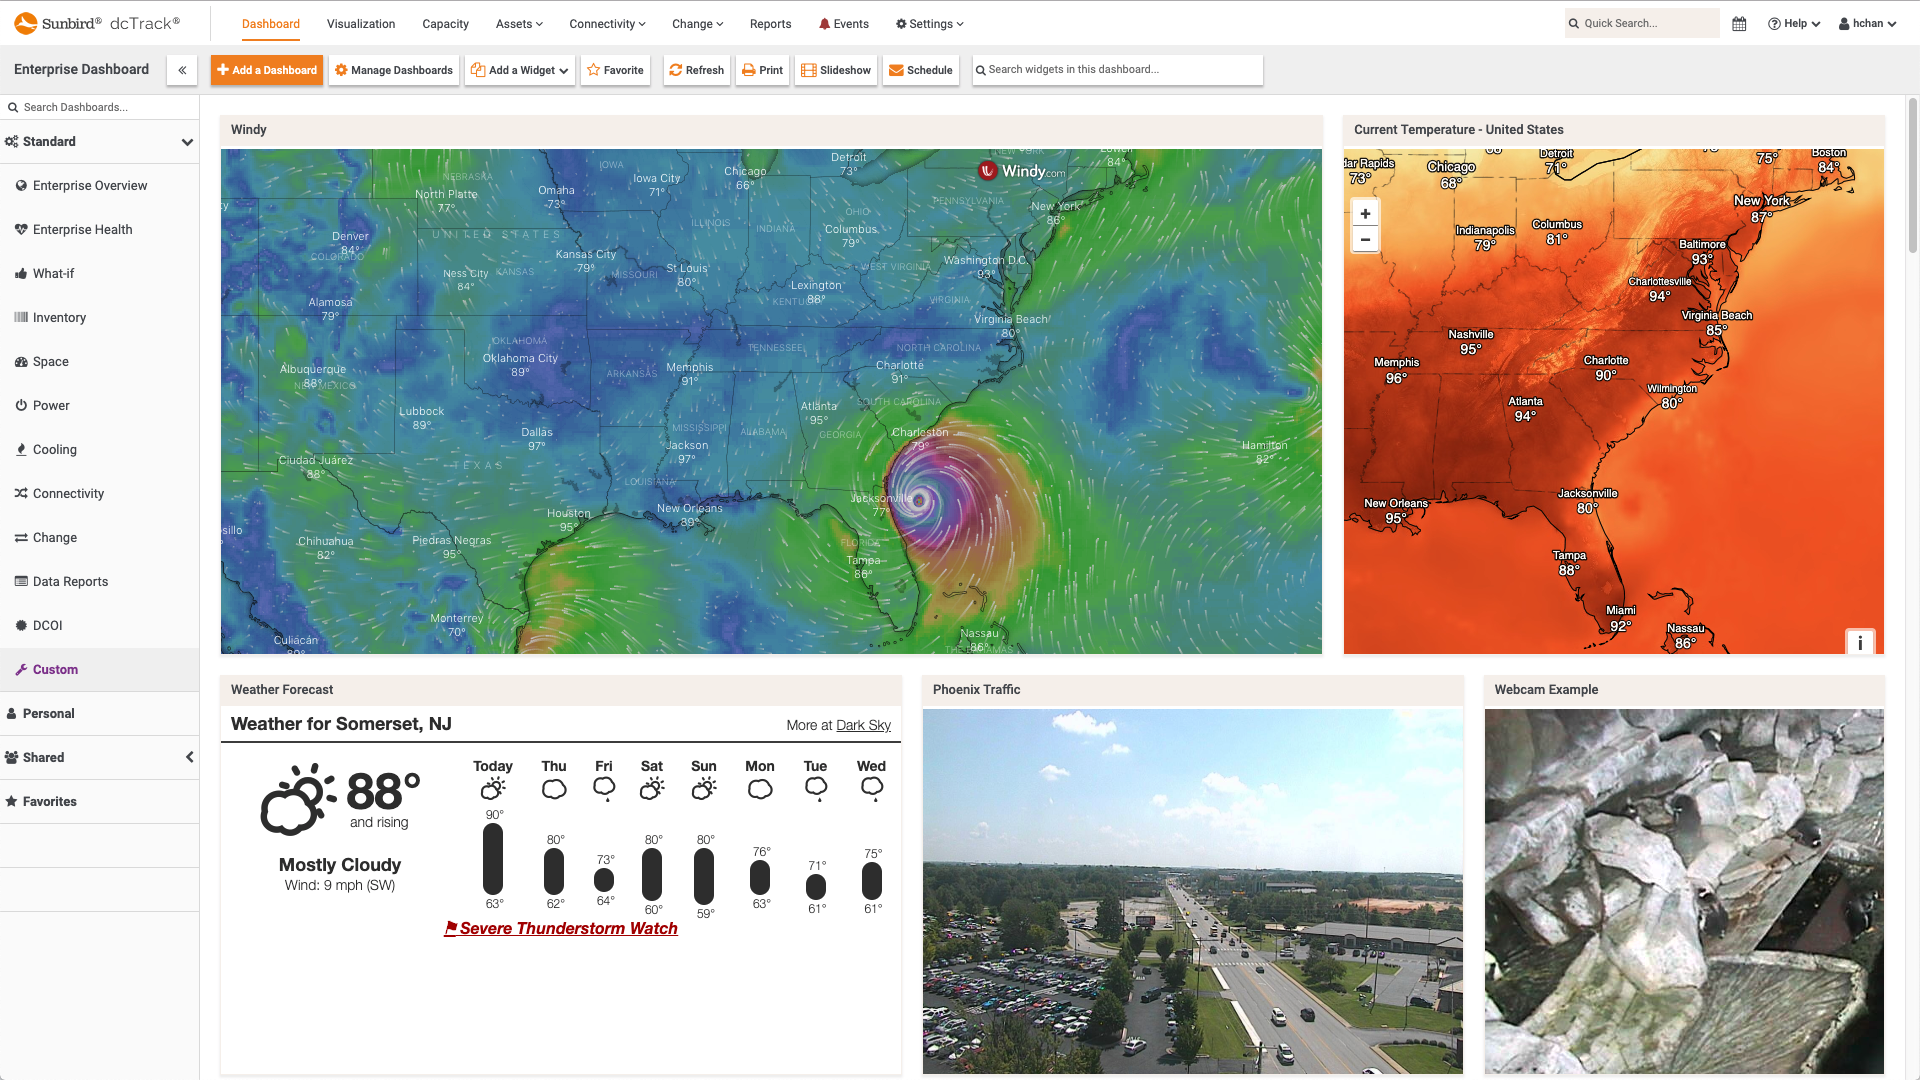
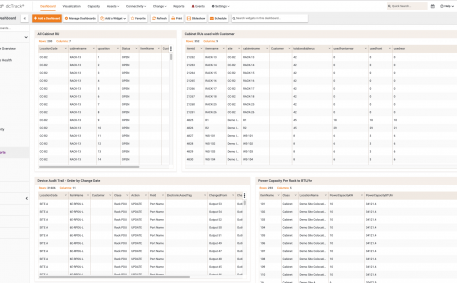
    The Custom Dashboard provides SQL or HTML widgets that can be customized to display the data you want, such as weather maps and live surveillance feeds.

    dcTrack DCIM Operations | BI & Data Analytics | Dashboards
    HTML and Web Cam Feeds for Dashboard Widgets
  • Screenshot of User Customizable SQL Report Widget
    Screenshot of User Customizable SQL Report Widget
    User Customizable SQL Report Widget

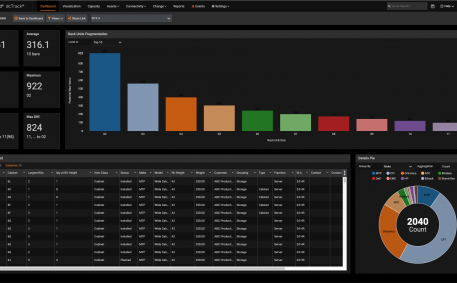
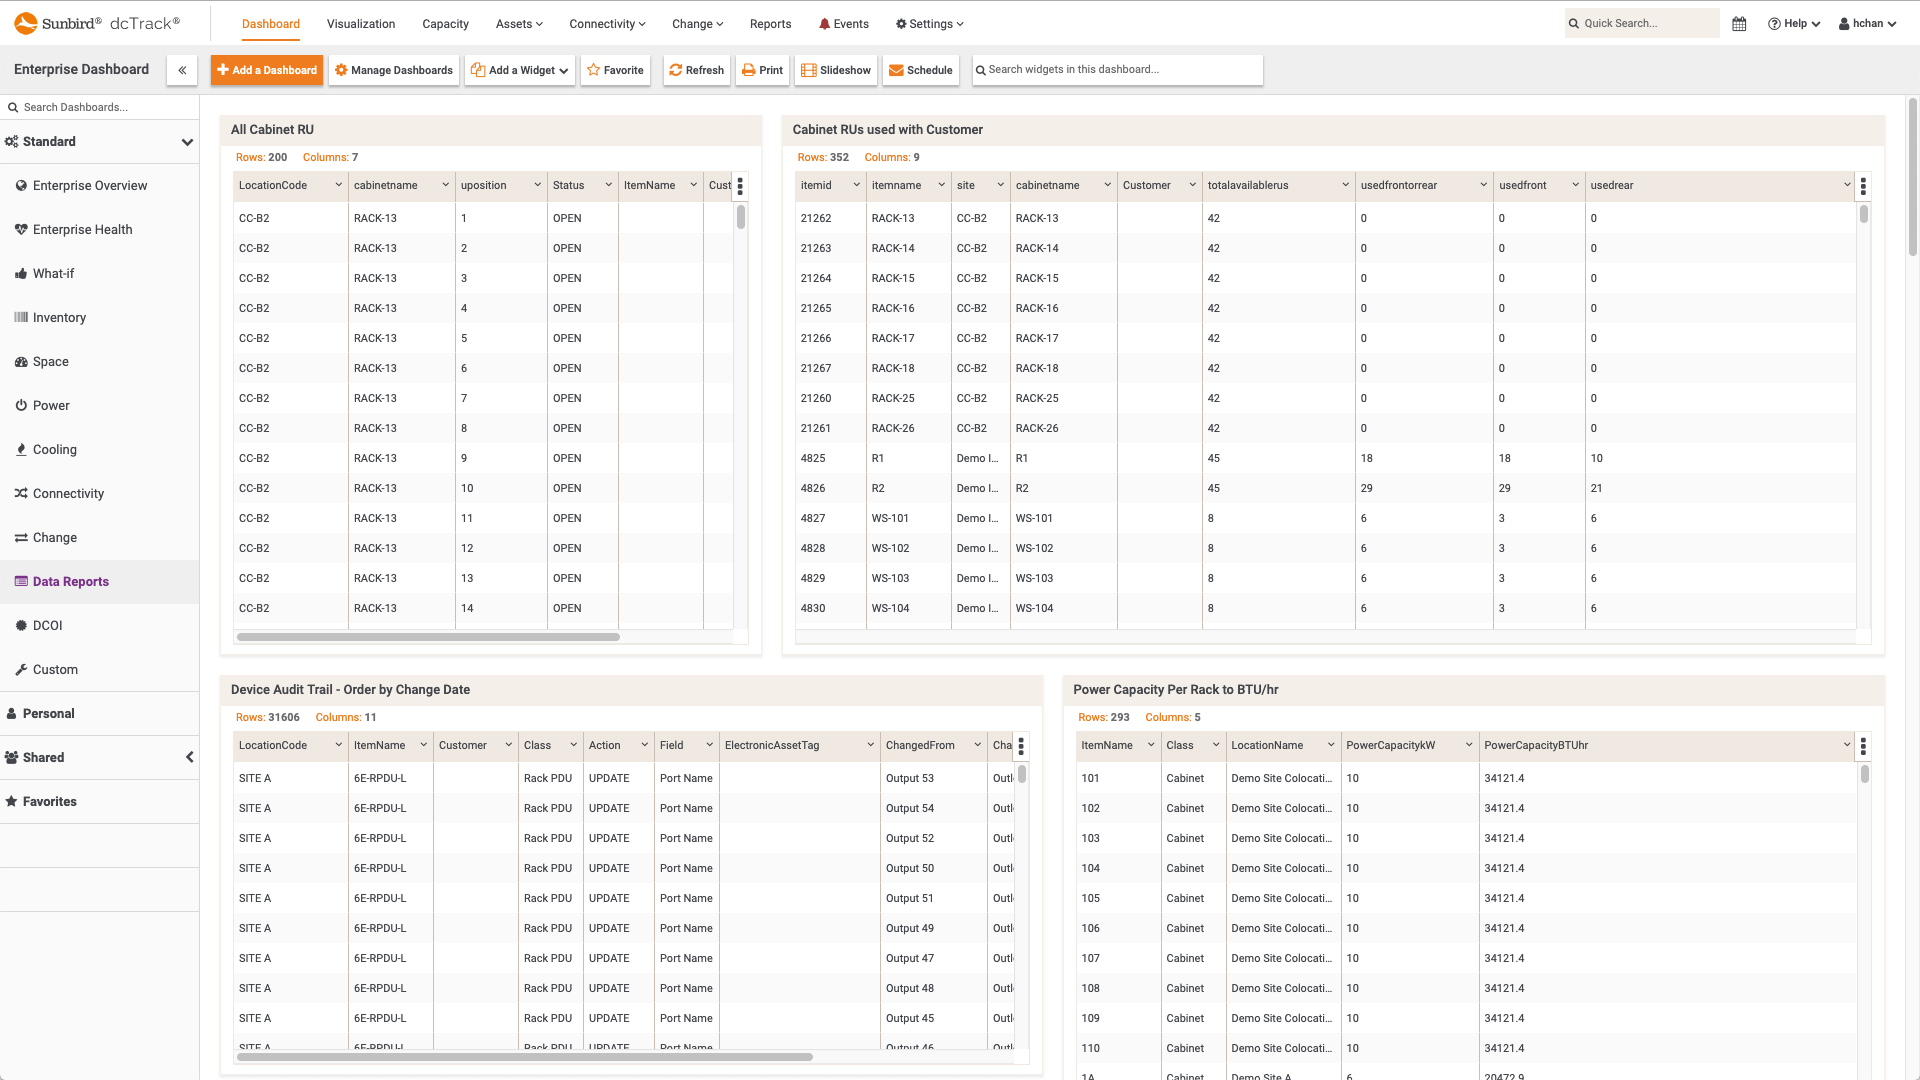
    The Data Reports Dashboard provides widgets that display data in tabular form.

    dcTrack DCIM Operations | BI & Data Analytics | Dashboards
    User Customizable SQL Report Widget
  • Screenshot of Change Dashboard
    Screenshot of Change Dashboard
    Change Dashboard

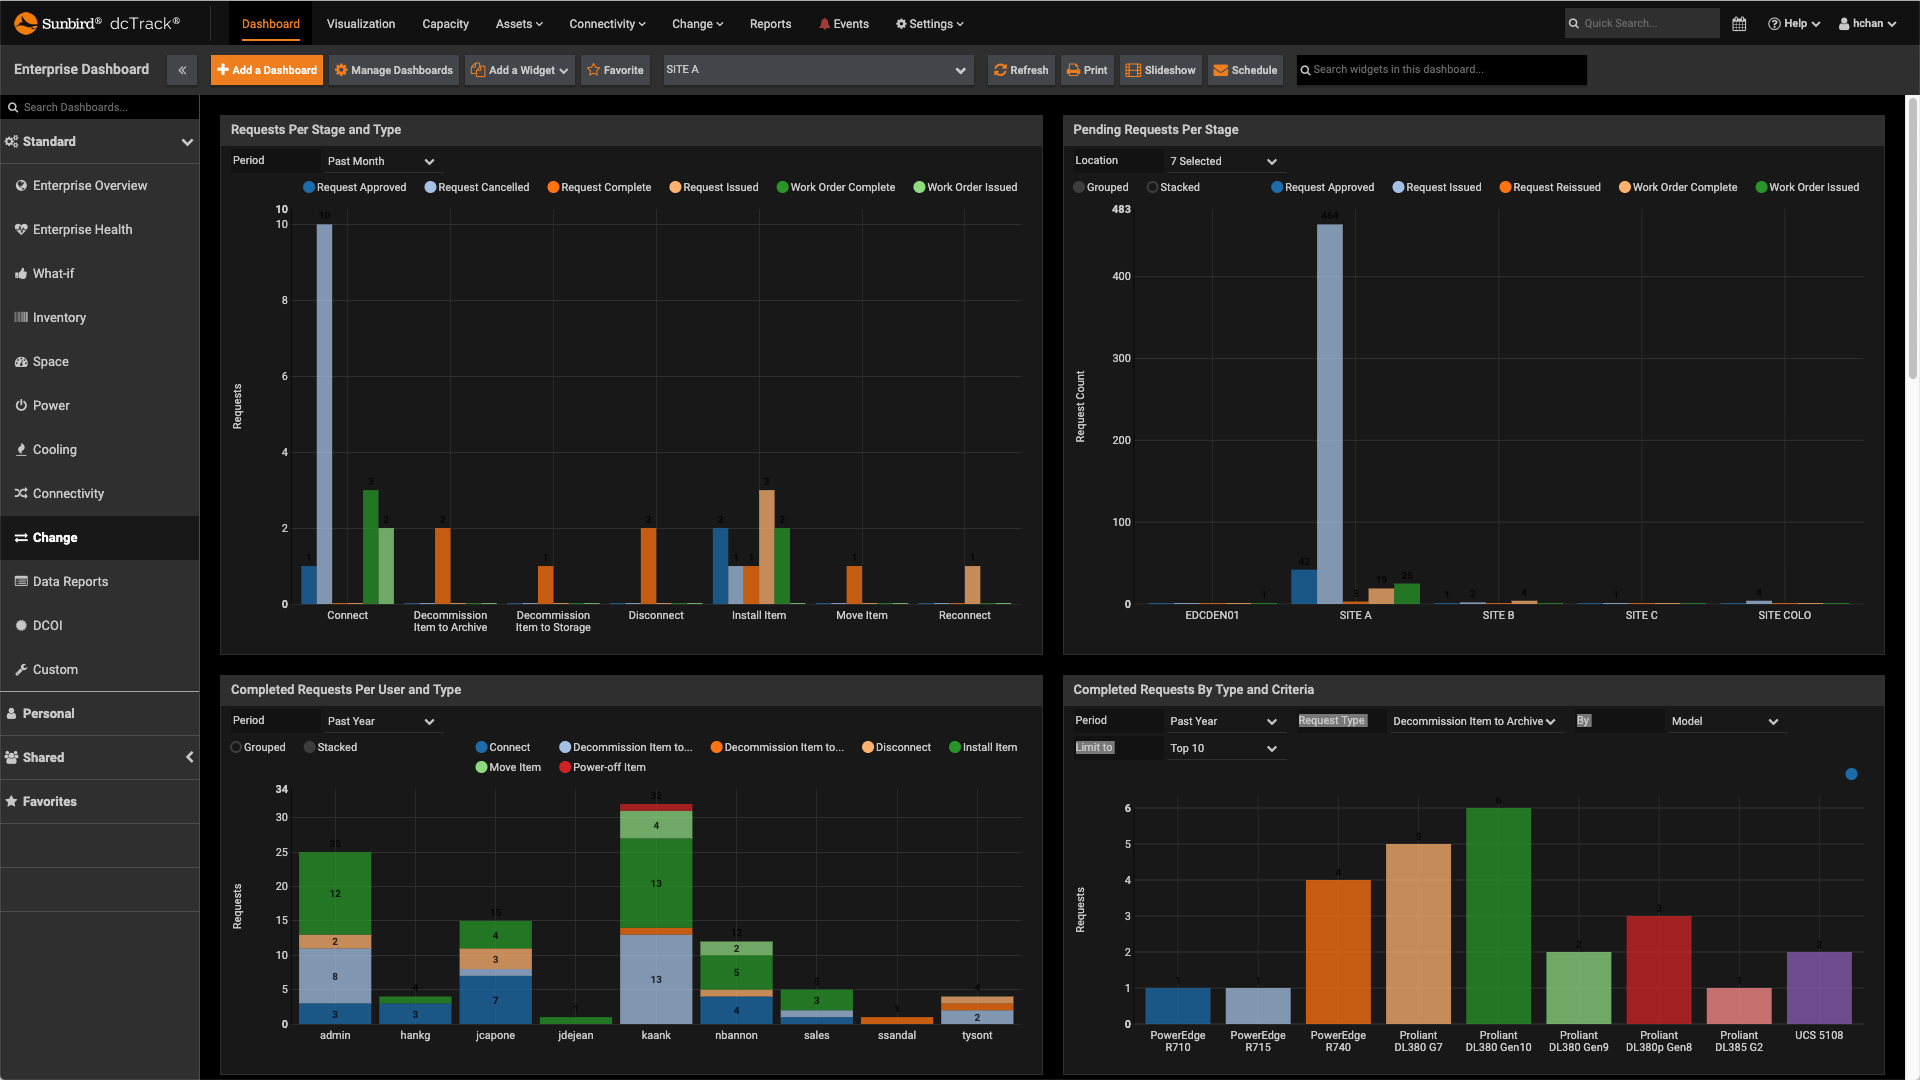
    The Change Dashboard provides widgets that display data on the moves, adds, and changes for a specific location.

    dcTrack DCIM Operations | Change Management | BI & Data Analytics | Dashboards
    Change Dashboard
  • Screenshot of Connectivity Dashboard
    Screenshot of Connectivity Dashboard
    Connectivity Dashboard

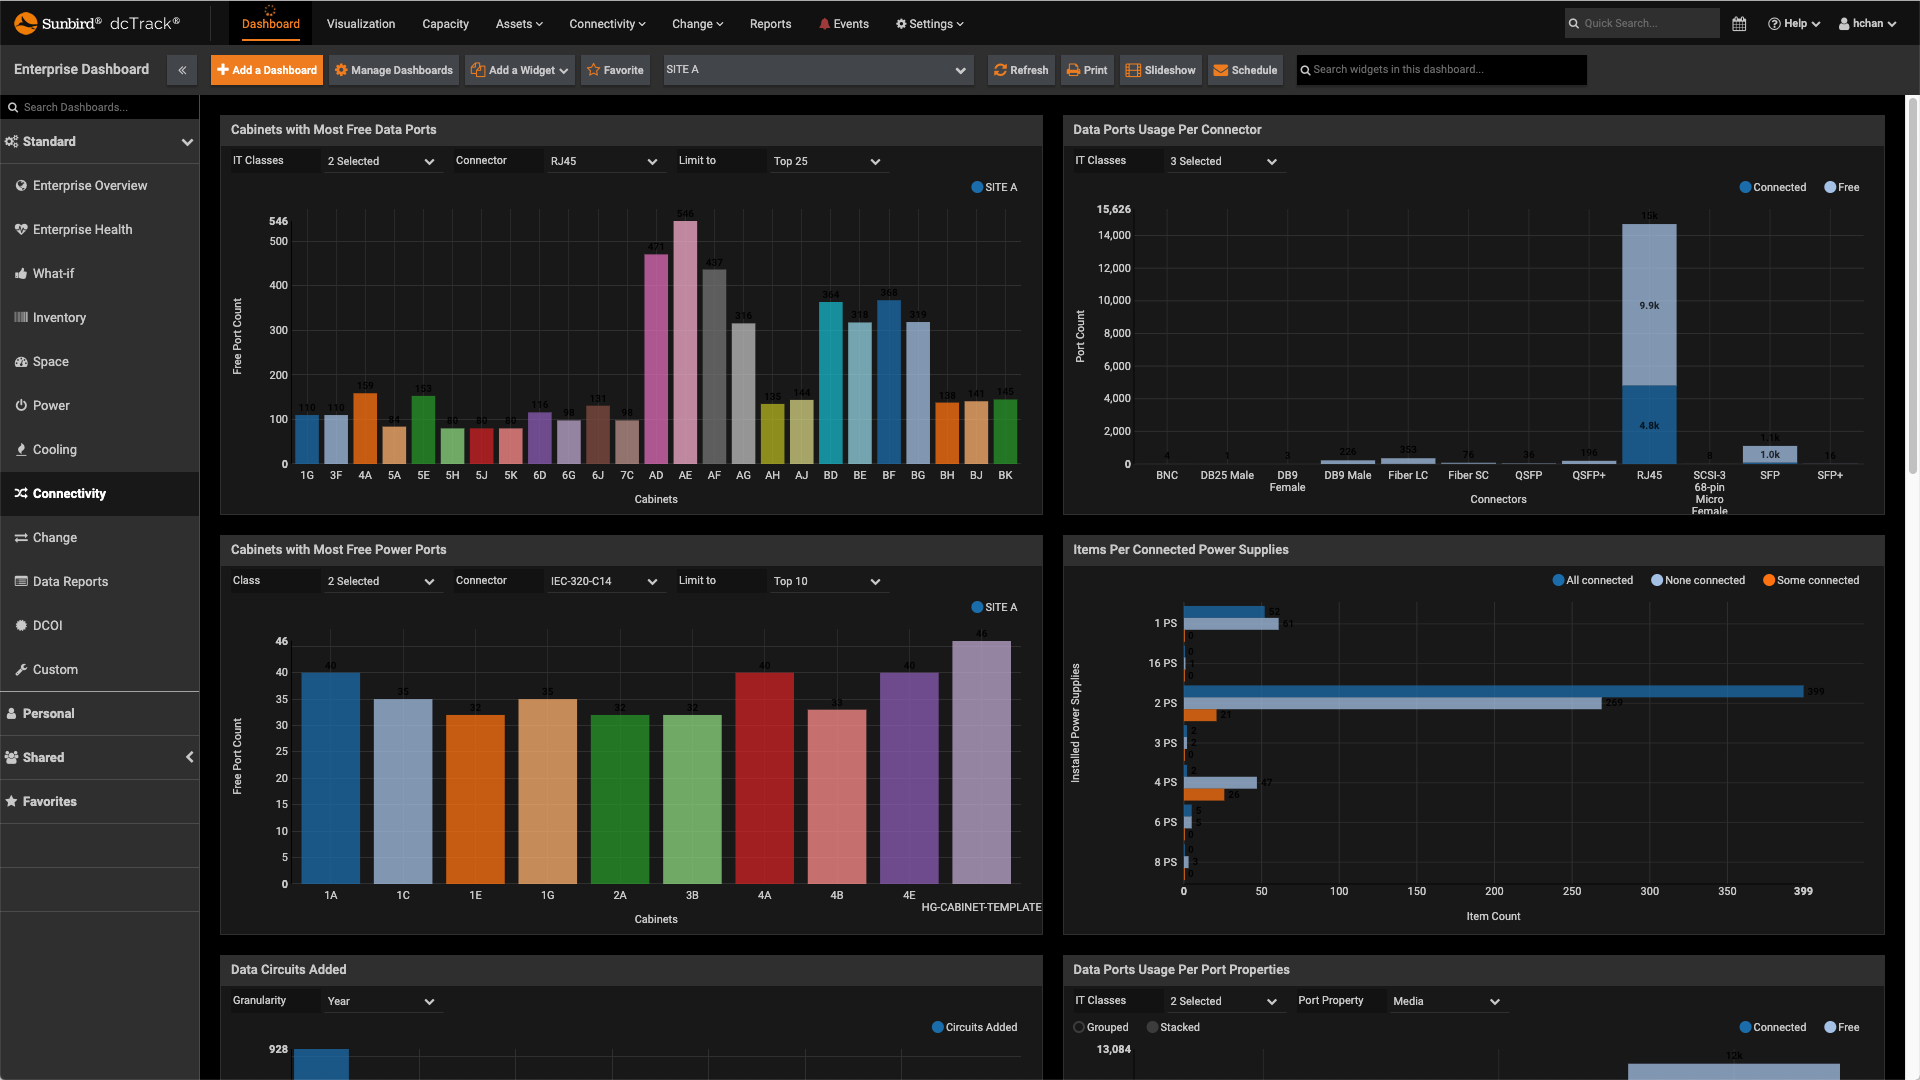
    The Connectivity Dashboard widgets that display data on the connections for a specific location.

    dcTrack DCIM Operations | Connectivity | BI & Data Analytics | Dashboards
    Connectivity Dashboard
  • Screenshot of Environment and Cooling Dashboard
    Screenshot of Environment and Cooling Dashboard
    Environment and Cooling Dashboard

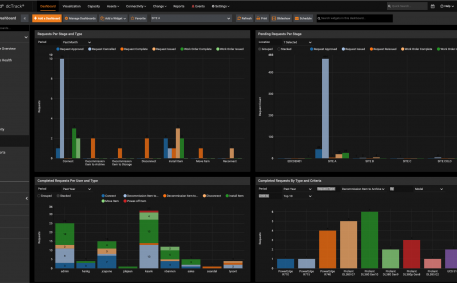
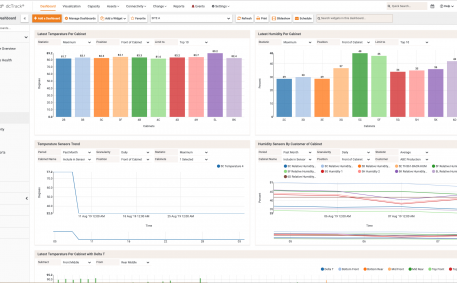
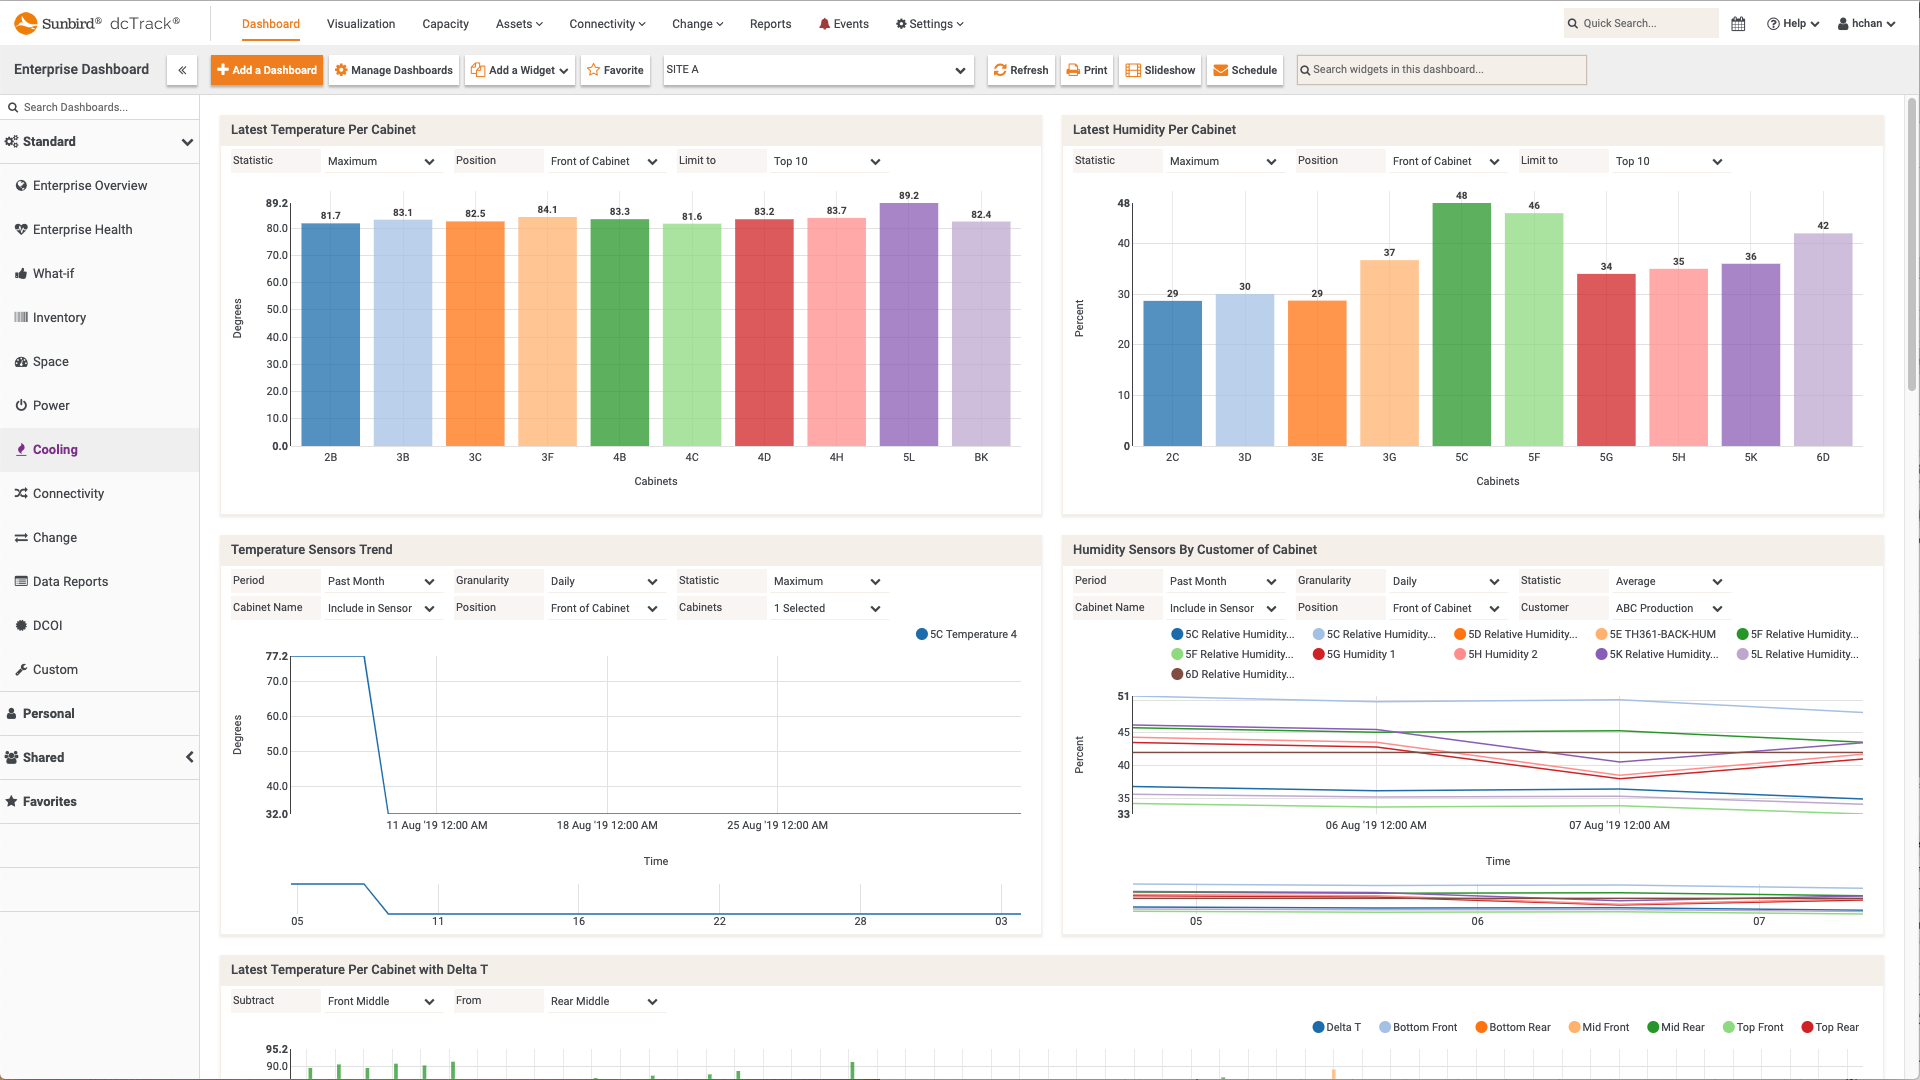
    The Cooling Dashboard provides widgets that display environmental data, including temperature and humidity, for a specific location.

    dcTrack DCIM Operations | BI & Data Analytics | Environment Management | Dashboards
    Environment and Cooling Dashboard
  • Screenshot of Power Dashboard
    Screenshot of Power Dashboard
    Power Dashboard

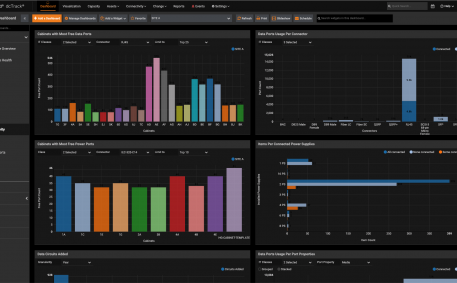
    The Power Dashboard provides widgets that display power capacity data for a specific location.

    dcTrack DCIM Operations | BI & Data Analytics | Power Management | Dashboards
    Power Dashboard
  • Screenshot of Space Dashboard
    Screenshot of Space Dashboard
    Space Dashboard

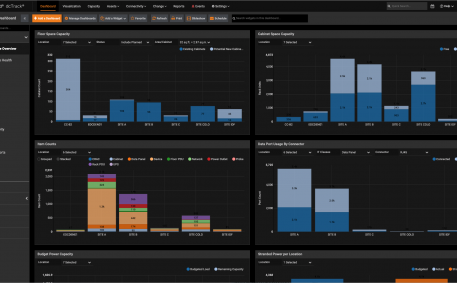
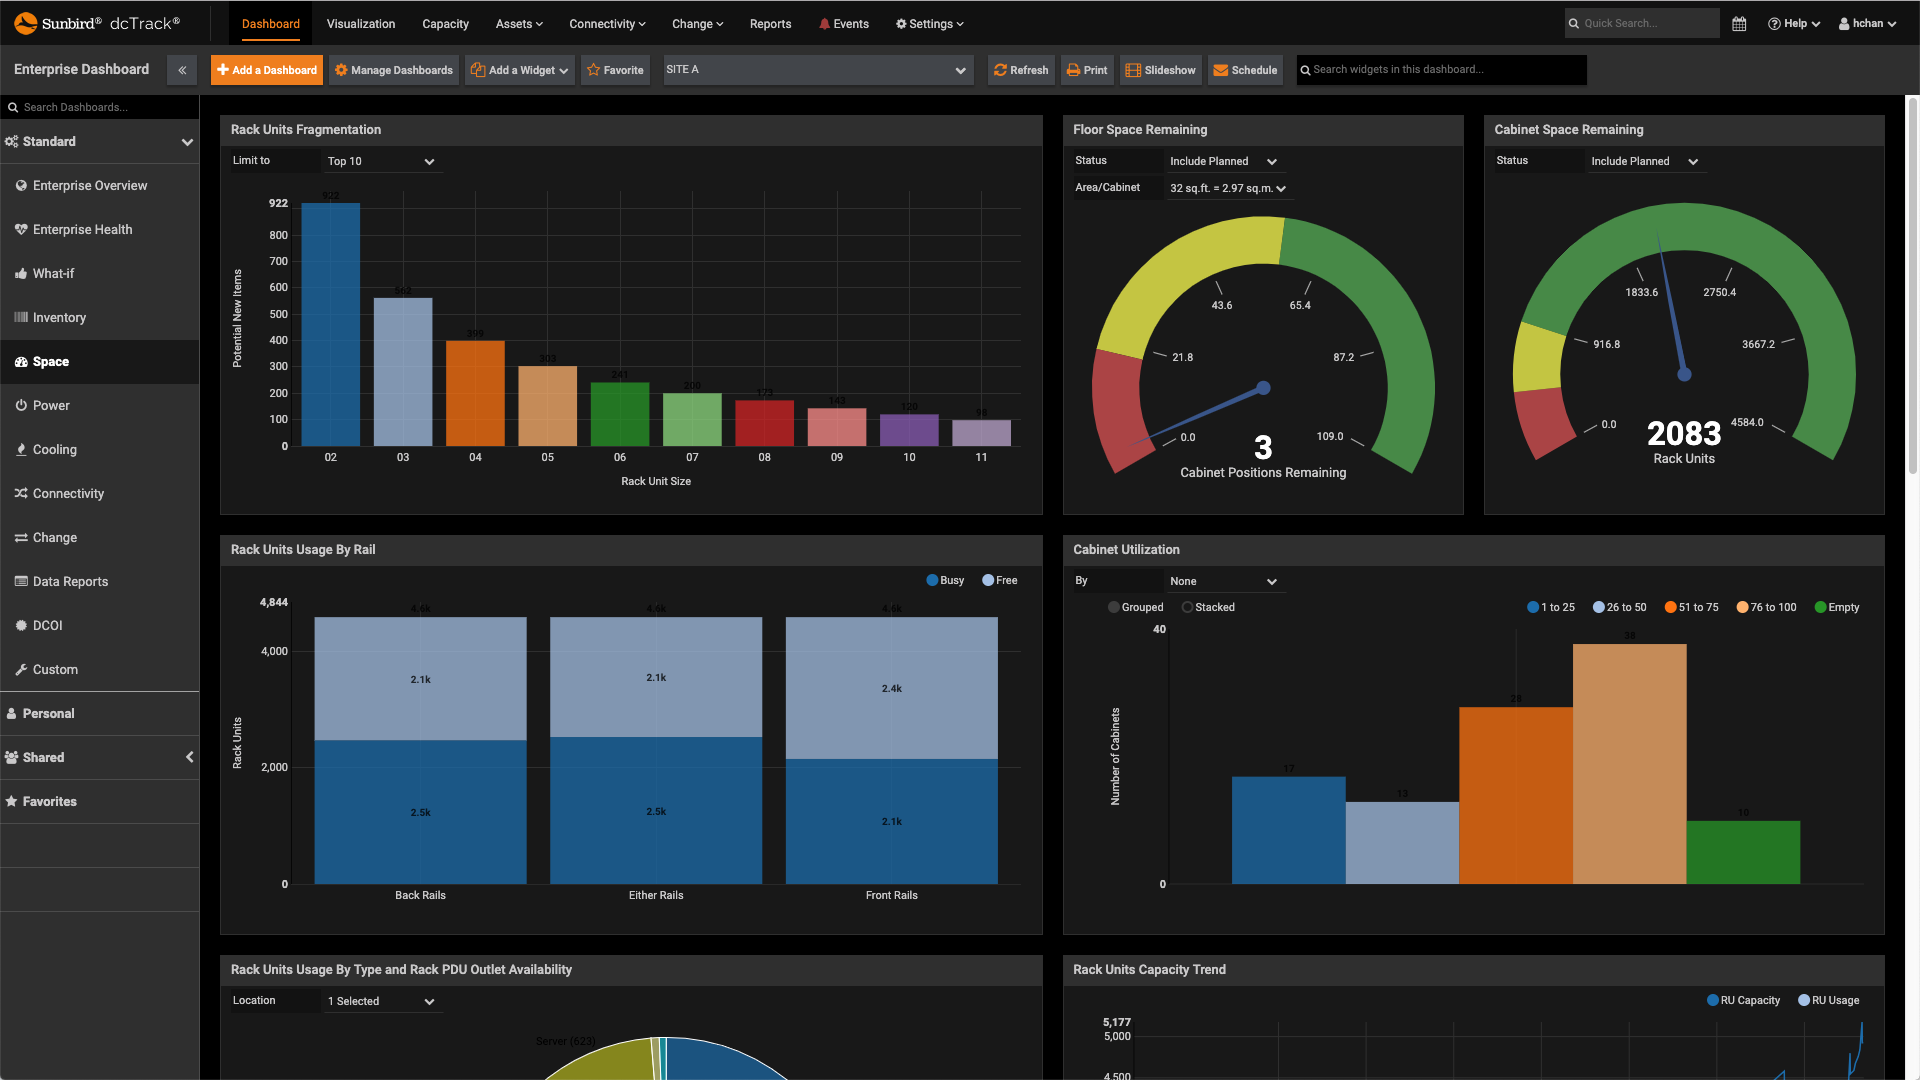
    The Space Dashboard provides widgets that display space capacity data for a specific location.

    dcTrack DCIM Operations | BI & Data Analytics | Dashboards
    Space Dashboard
  • Screenshot of Inventory Dashboard
    Screenshot of Inventory Dashboard
    Inventory Dashboard

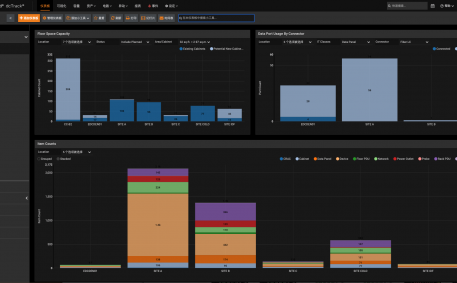
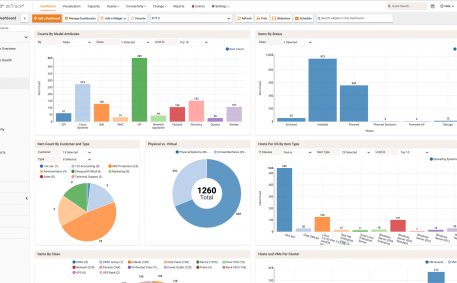
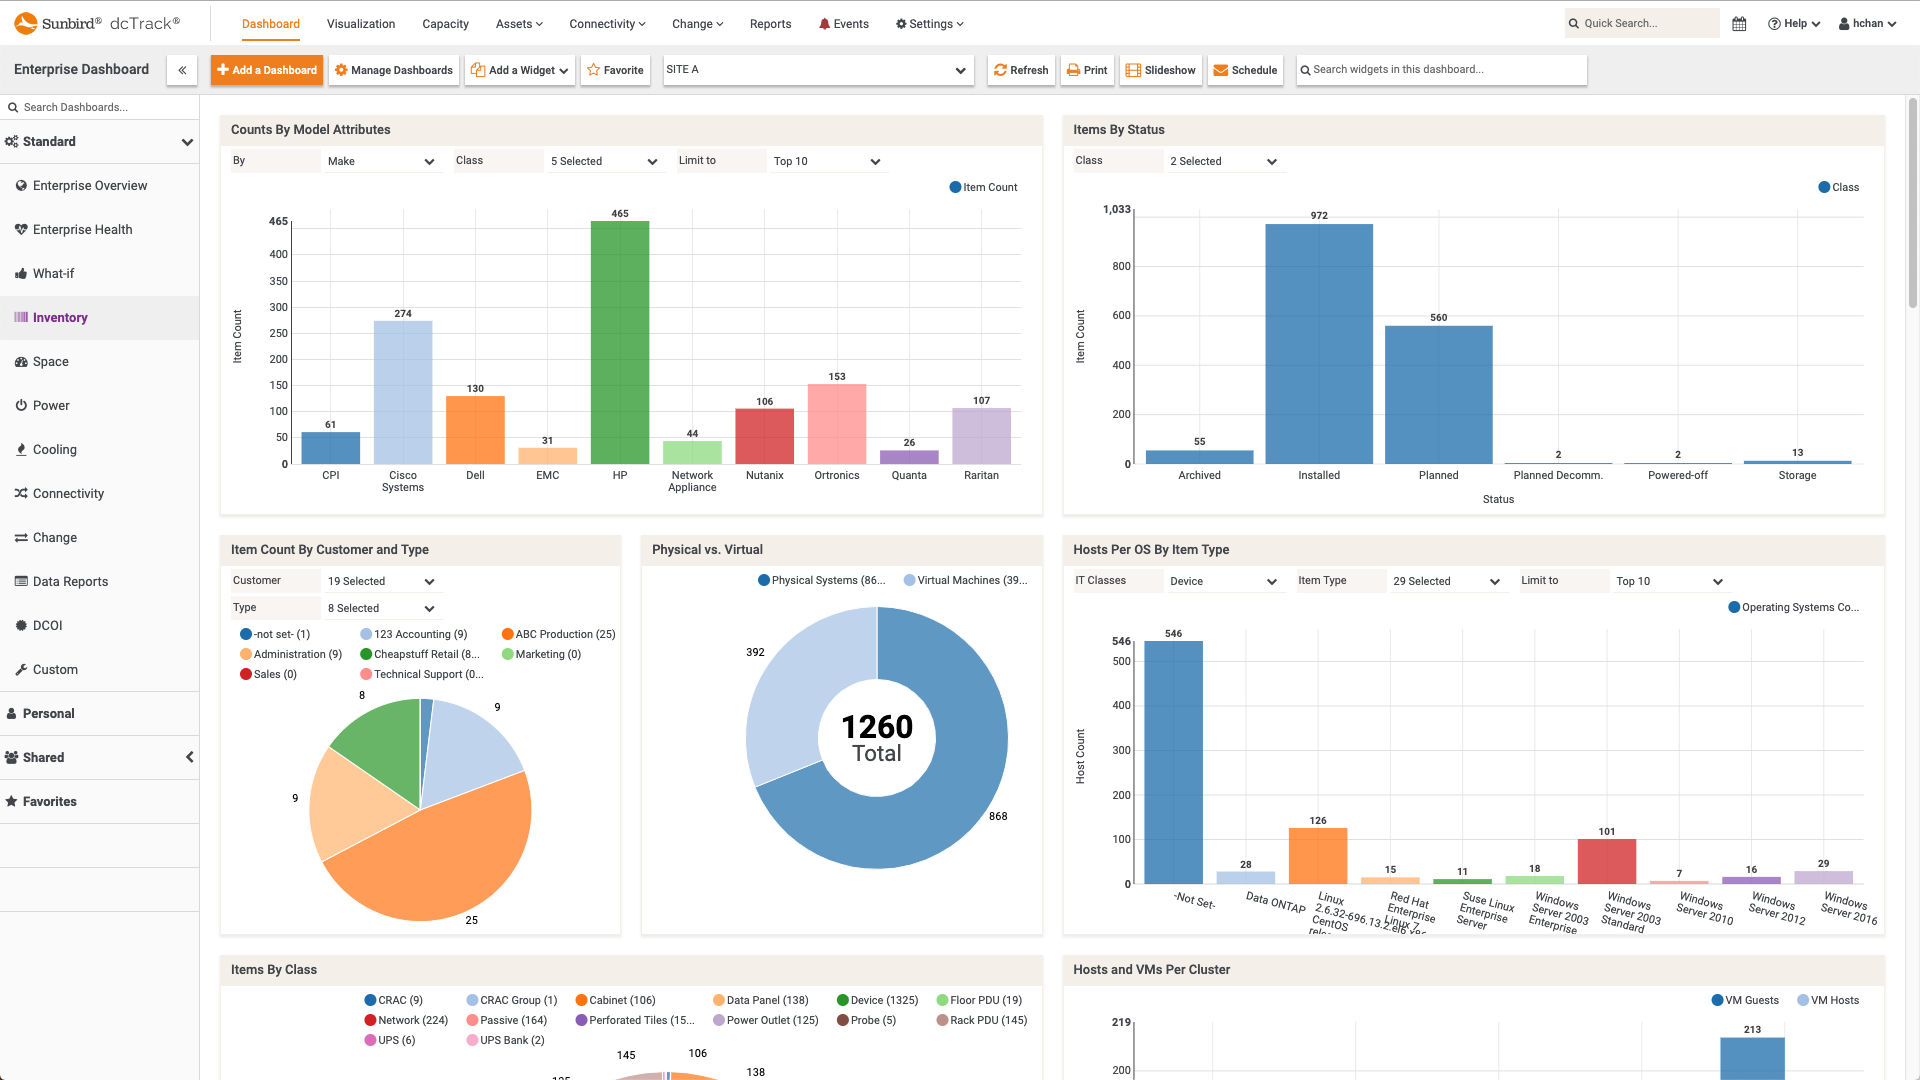
    The Inventory Dashboard display data on the assets for a specific location.

    dcTrack DCIM Operations | BI & Data Analytics | Dashboards
    Inventory Dashboard
  • Screenshot of Enterprise Health Dashboard
    Screenshot of Enterprise Health Dashboard
    Enterprise Health Dashboard

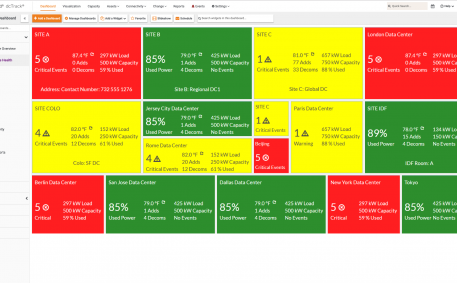
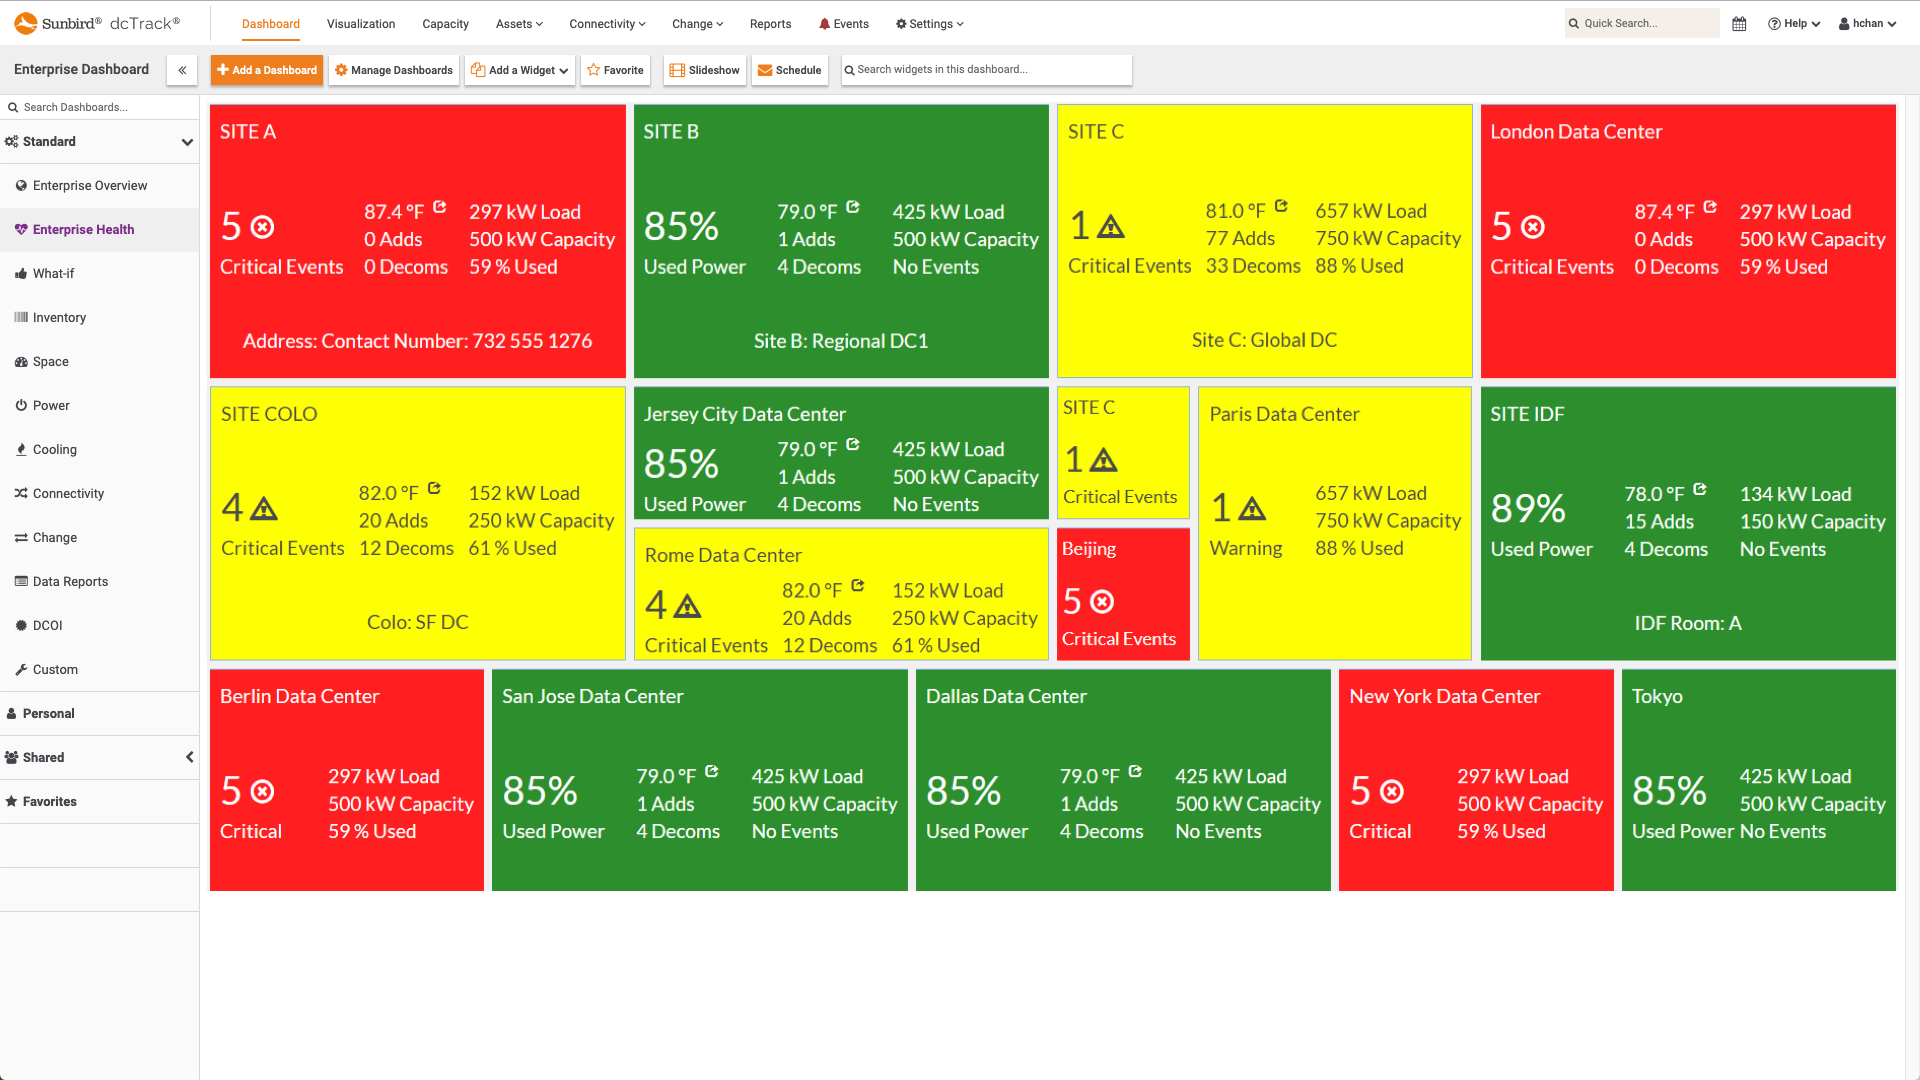
    The Enterprise Health Dashboard provides tile widgets that display color-coded warning and critical health event data for locations in your enterprise.

    dcTrack DCIM Operations | BI & Data Analytics | Dashboards
    Enterprise Health Dashboard
  • Screenshot of Multi-Site Enterprise Overview Dashboard
    Screenshot of Multi-Site Enterprise Overview Dashboard
    Multi-Site Enterprise Overview Dashboard

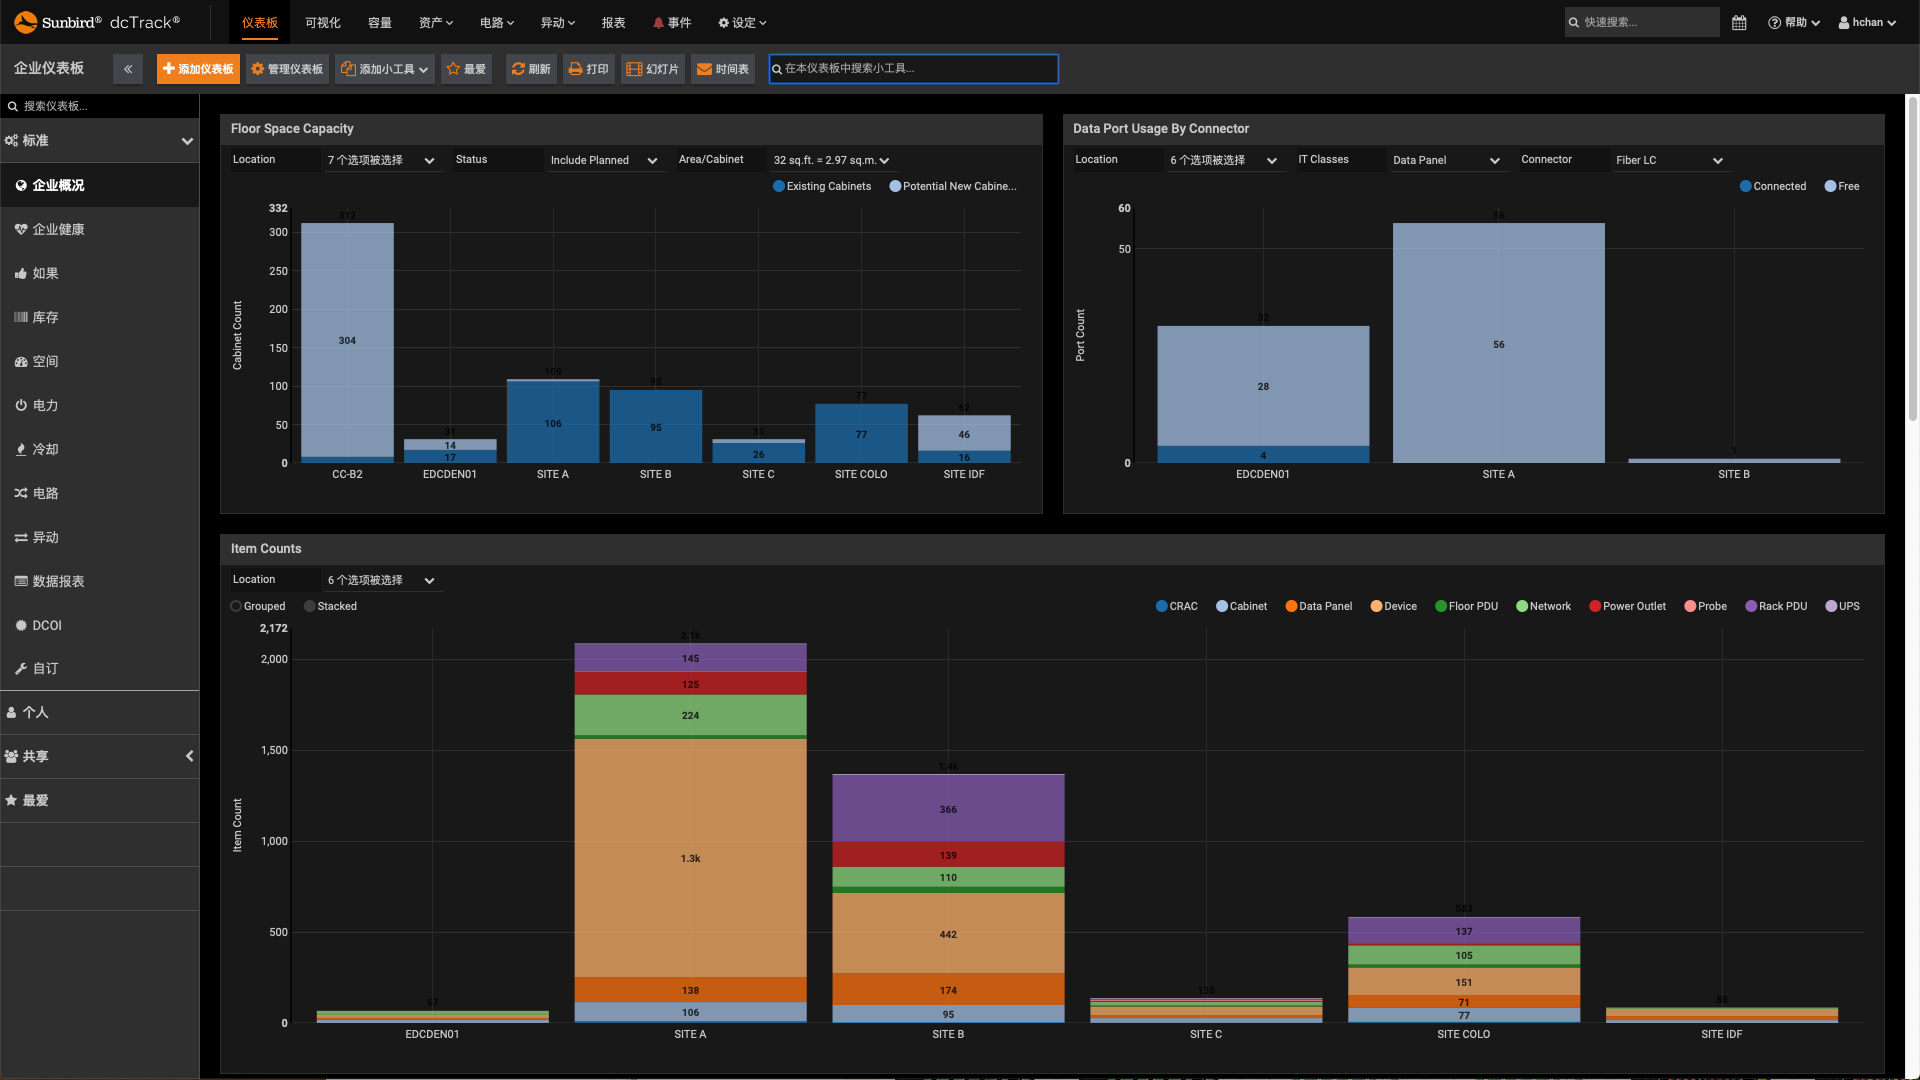
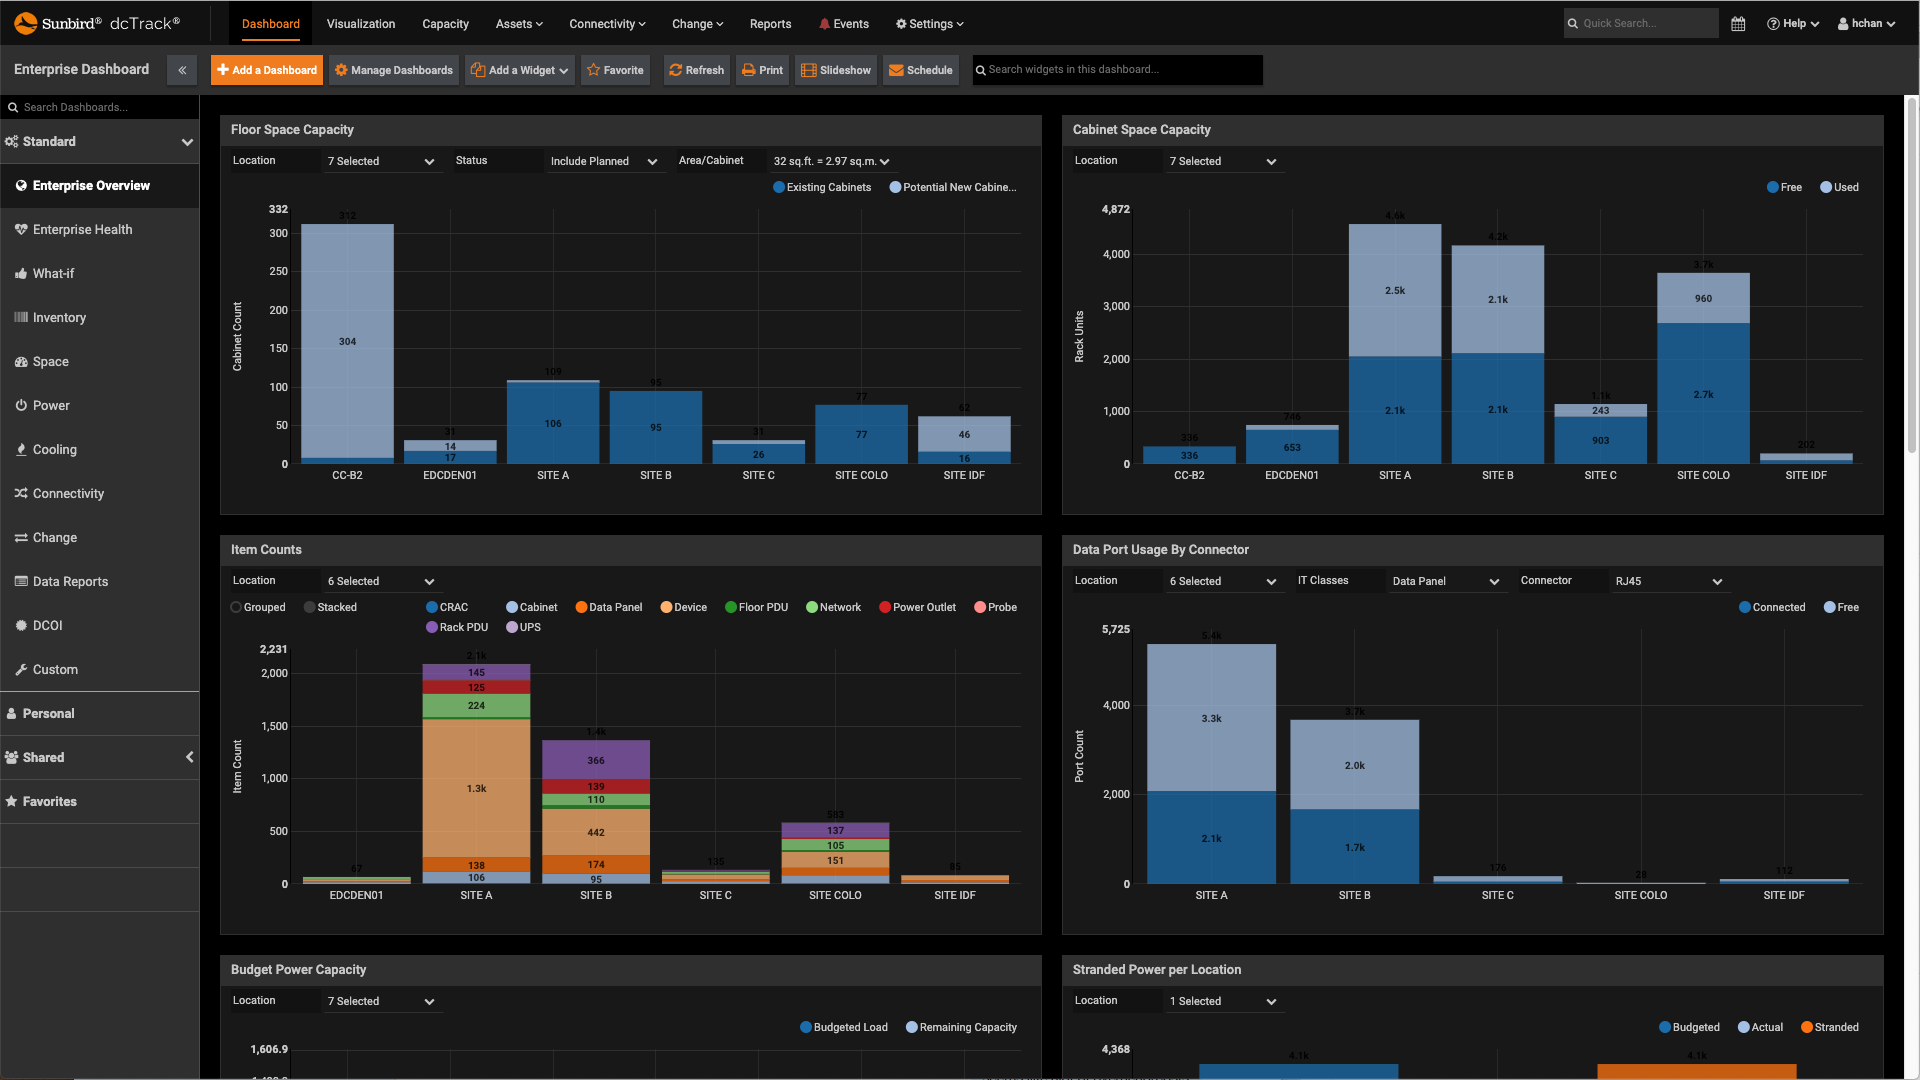
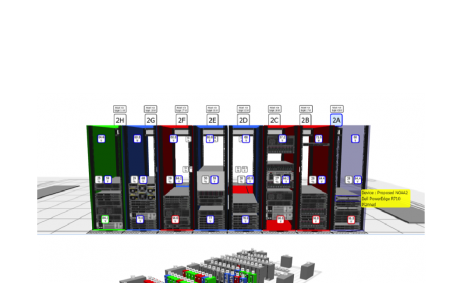
    The Enterprise Dashboard provides widgets that display data on all locations or sites in your enterprise.

    dcTrack DCIM Operations | BI & Data Analytics | Dashboards
    Multi-Site Enterprise Overview Dashboard
  • Screenshot of 3D Visualization
    Screenshot of 3D Visualization
    3D Visualization

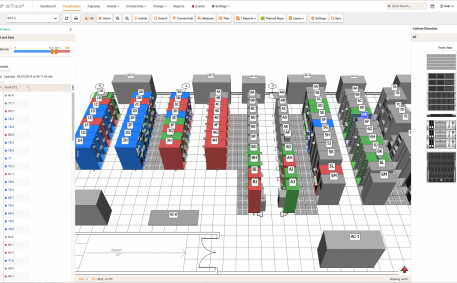
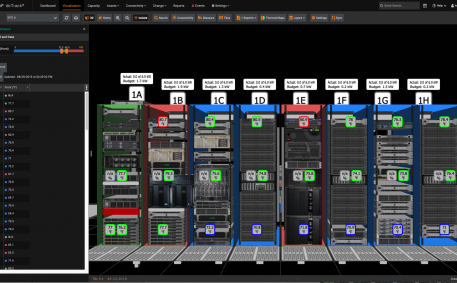
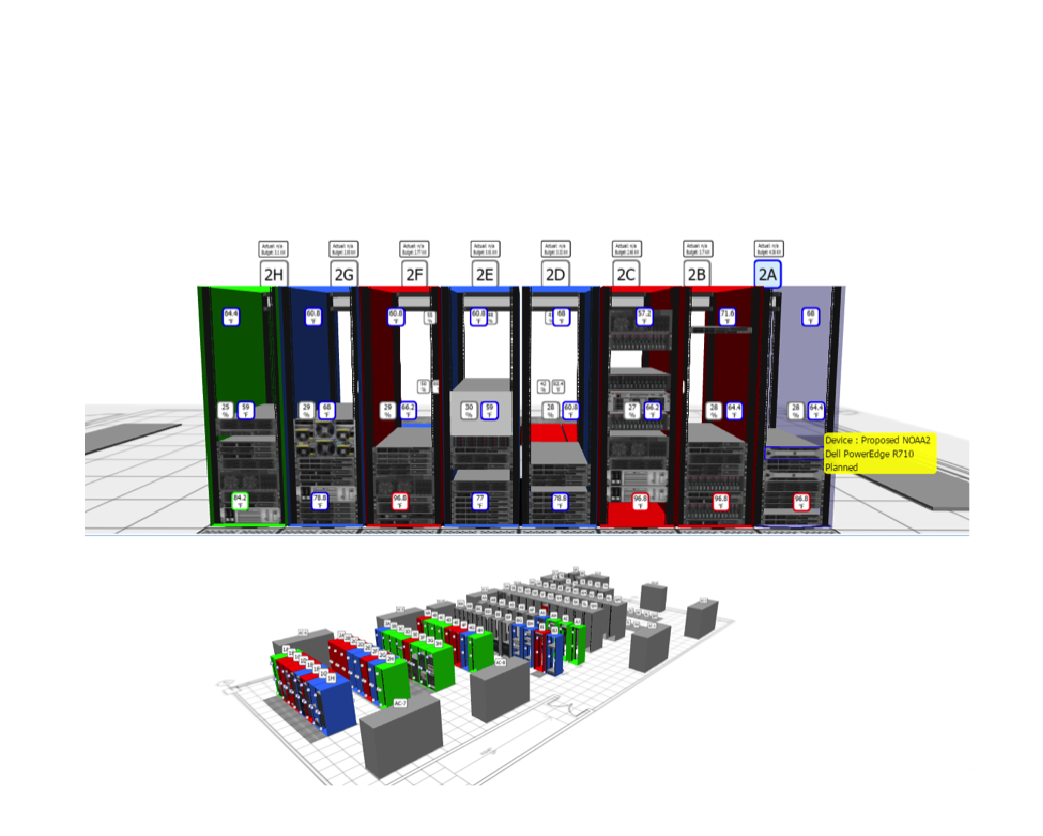
    Visualize cabinet and row elevations as if you are standing in front of them. Easily see cabinet contents including name, make, model and status. Monitor user configurable thresholds for space, power and cooling with ability to see near real-time readings for power, temperature and humidity.

    dcTrack DCIM Operations | Visualization
    3D Visualization
  • Screenshot of Cabinet Level Power Usage Trends at Inlet, Breaker, and Outlet Levels
    Screenshot of Cabinet Level Power Usage Trends at Inlet, Breaker, and Outlet Levels
    Cabinet Level Power Usage Trends at Inlet, Breaker, and Outlet Levels

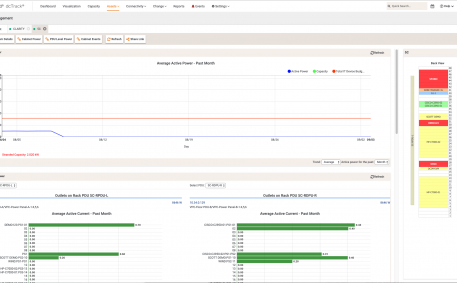
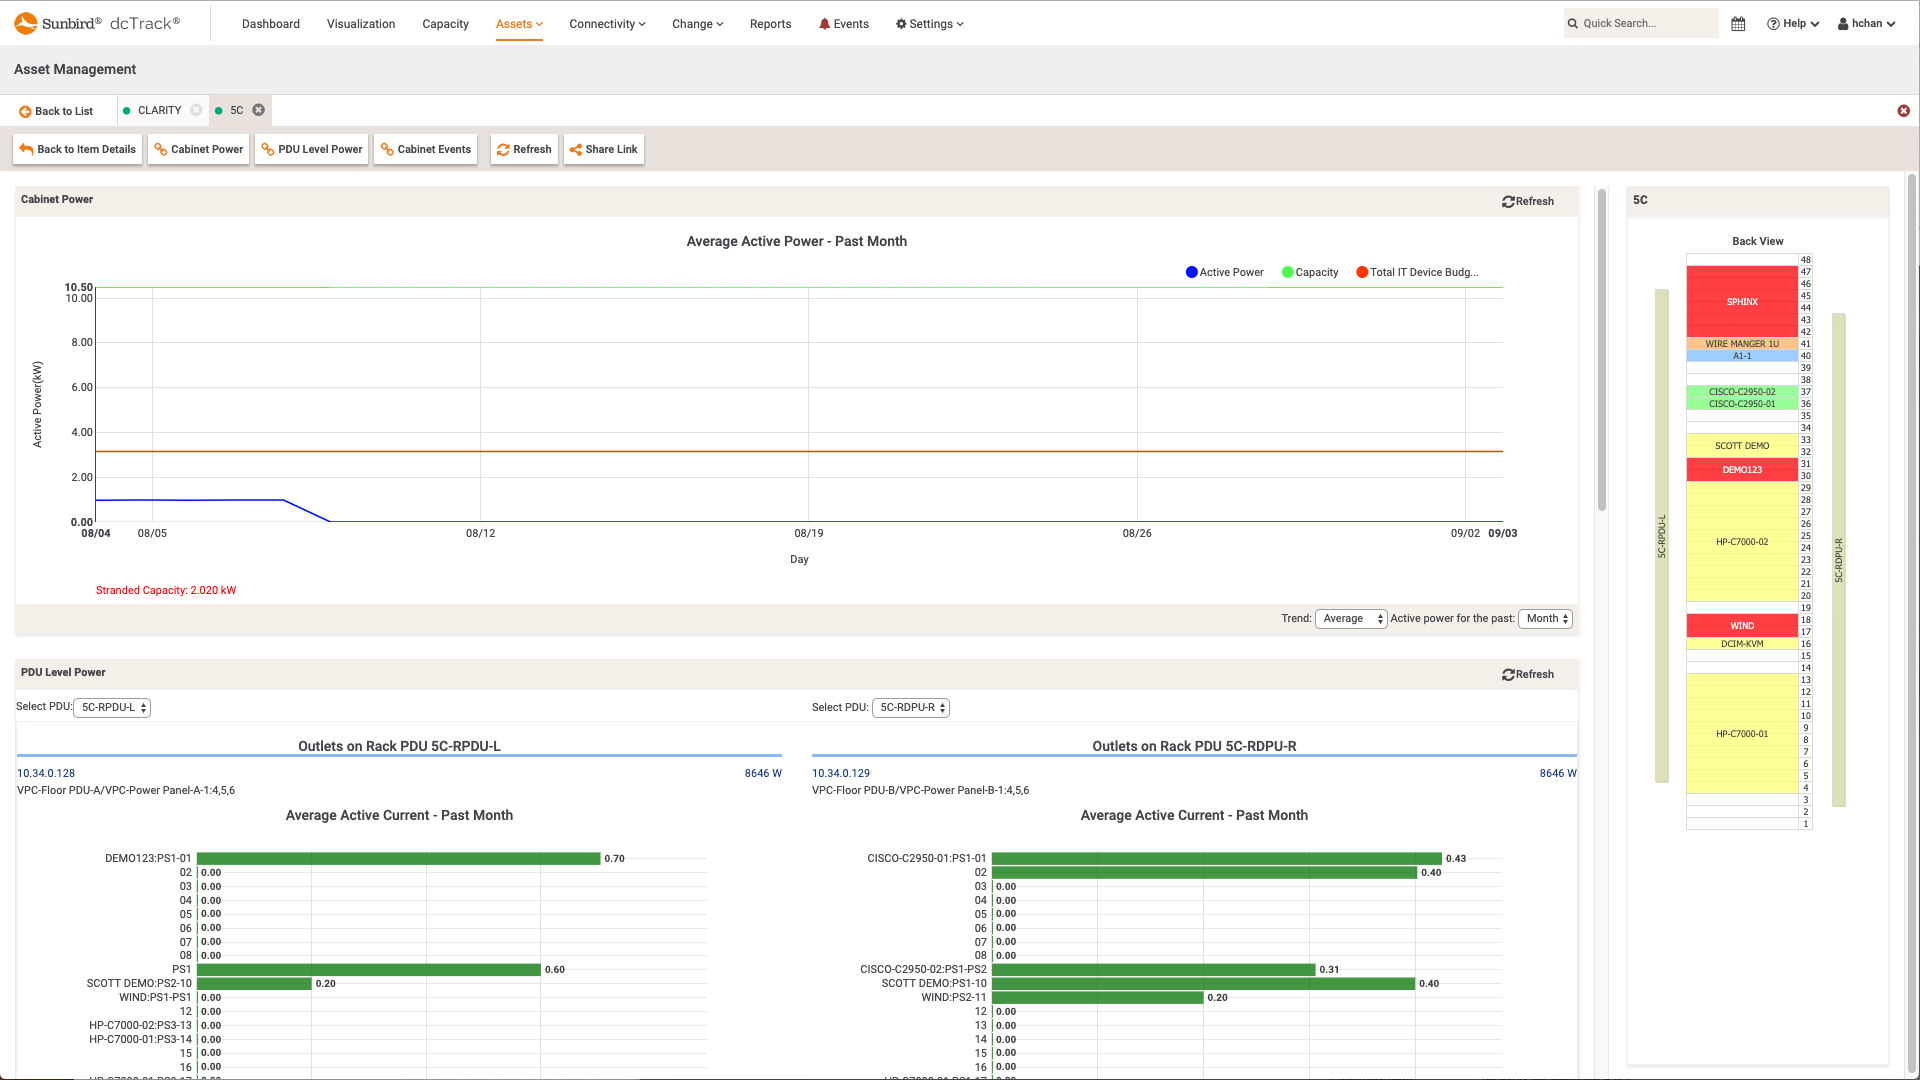
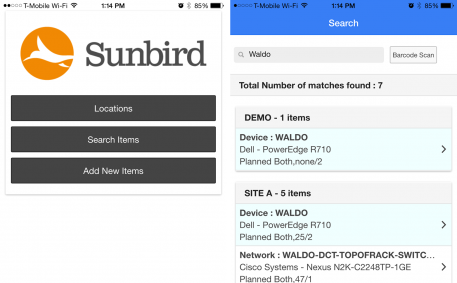
    Smart charts display average active power, power capacity, events, and other information at the cabinet level.

    dcTrack DCIM Operations | Power Management | Capacity Management
    Cabinet Level Power Usage Trends at Inlet, Breaker, and Outlet Levels
  • Screenshot of Paperless Audit Mobile App
    Screenshot of Paperless Audit Mobile App
    Paperless Audit Mobile App

    Access information from anywhere with your choice of smart phone or tablet with our mobile app. Create, read, update and delete items via your mobile device, and scan a cabinet bar code and view its full configuration. The app improves inventory management by enabling paperless audits and updates on the fly.

    dcTrack DCIM Operations | Asset Management
    Paperless Audit Mobile App
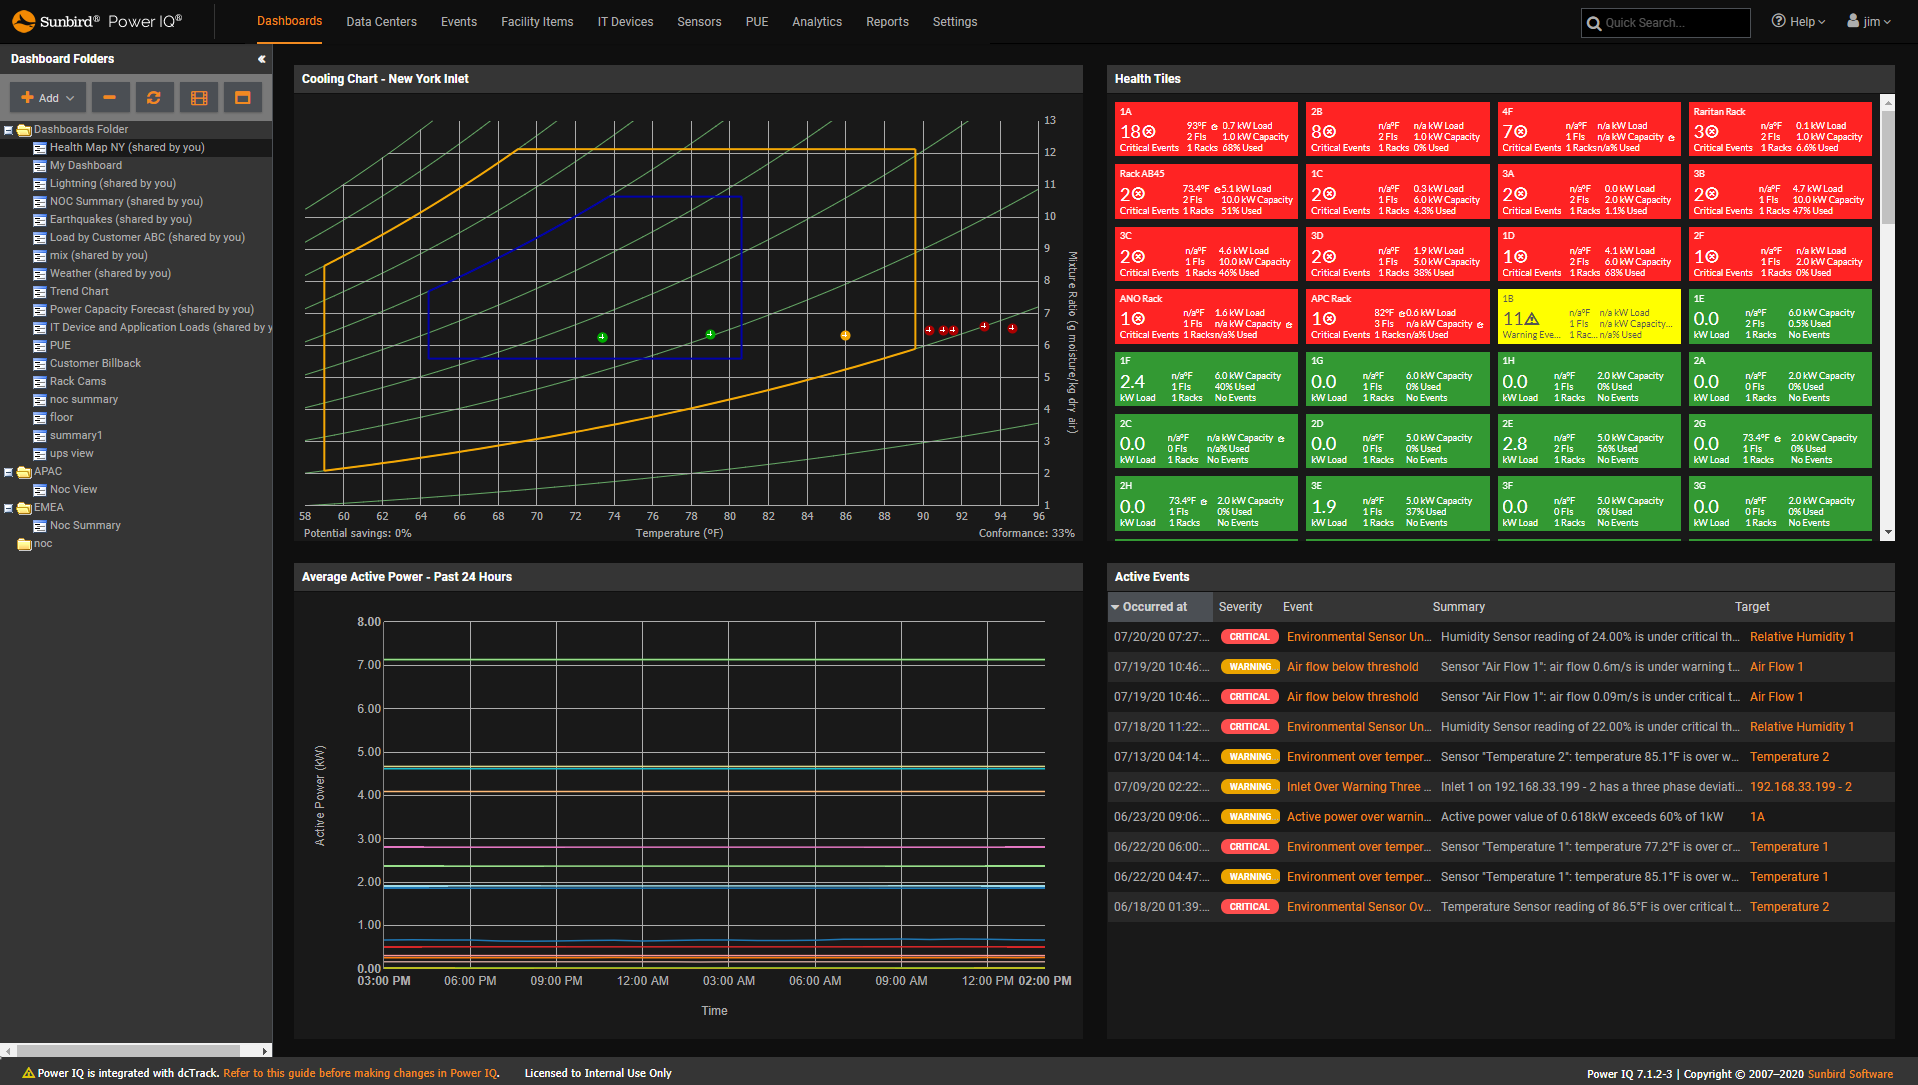
  • Screenshot of Health and Capacity Widgets - Dark Mode
    Screenshot of Health and Capacity Widgets - Dark Mode
    Health and Capacity Widgets - Dark Mode

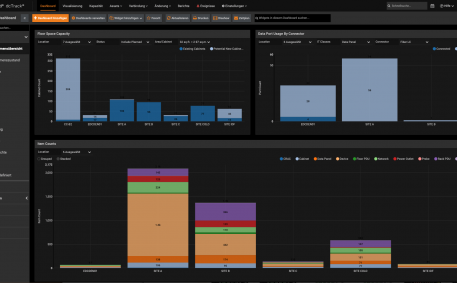
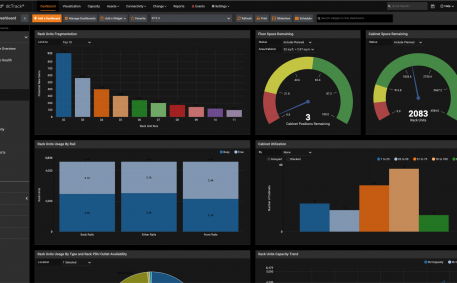
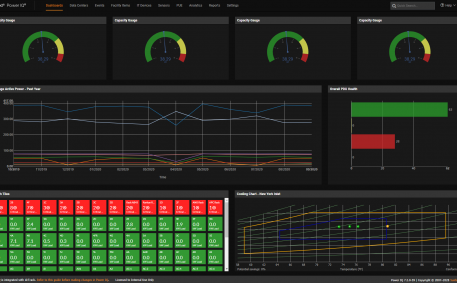
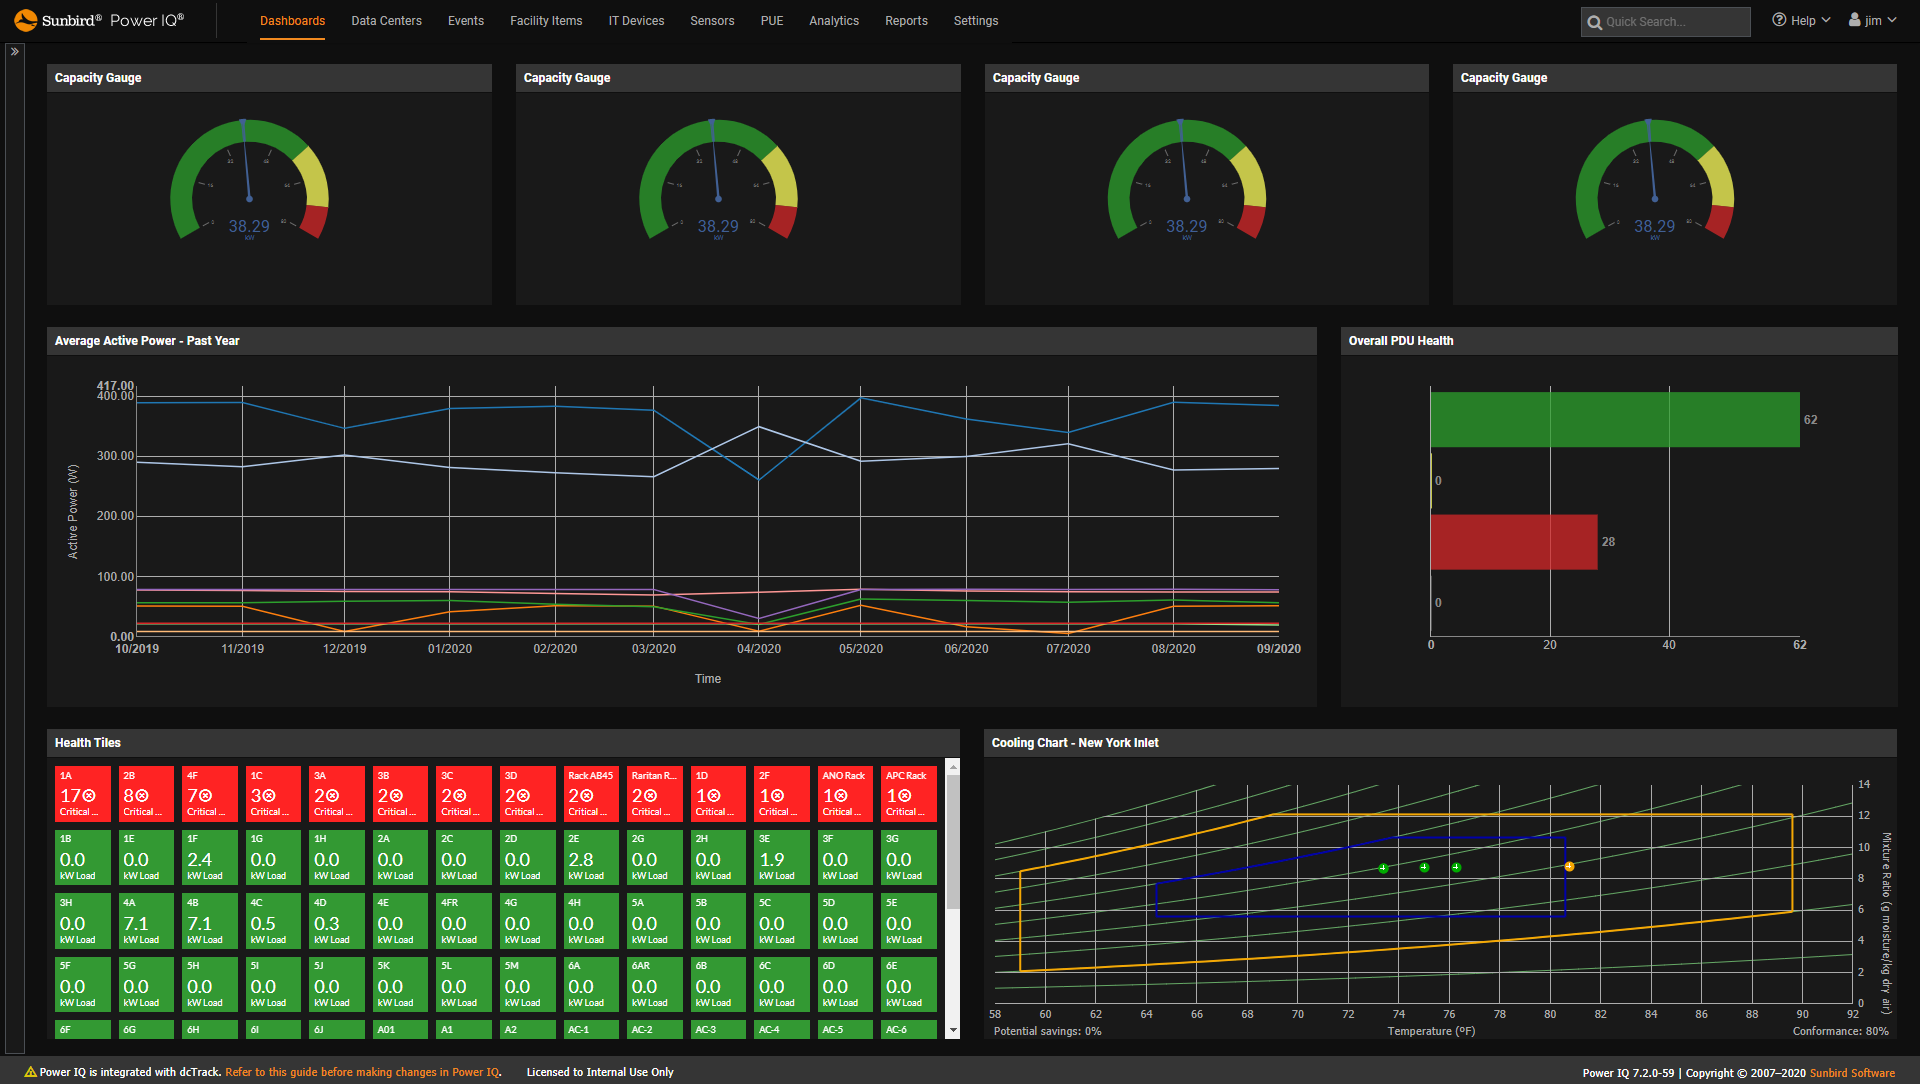
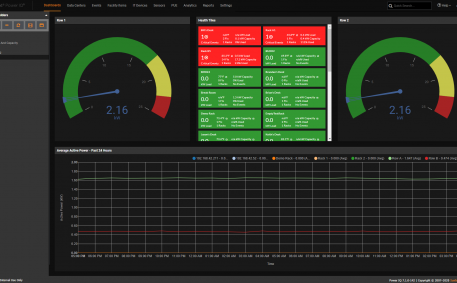
    This sample dashboard shows the health and capacity of racks and locations.

    Power IQ DCIM Monitoring | Dashboards | Power Management
    Health and Capacity Widgets - Dark Mode
  • Screenshot of Environmental Sensor Threshold Monitoring and Reporting
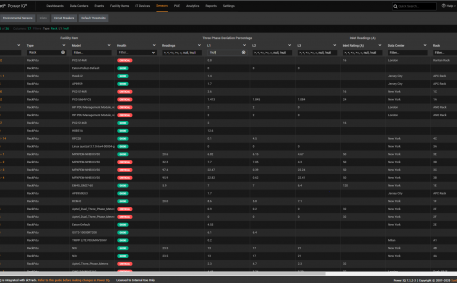
    Screenshot of Environmental Sensor Threshold Monitoring and Reporting
    Environmental Sensor Threshold Monitoring and Reporting

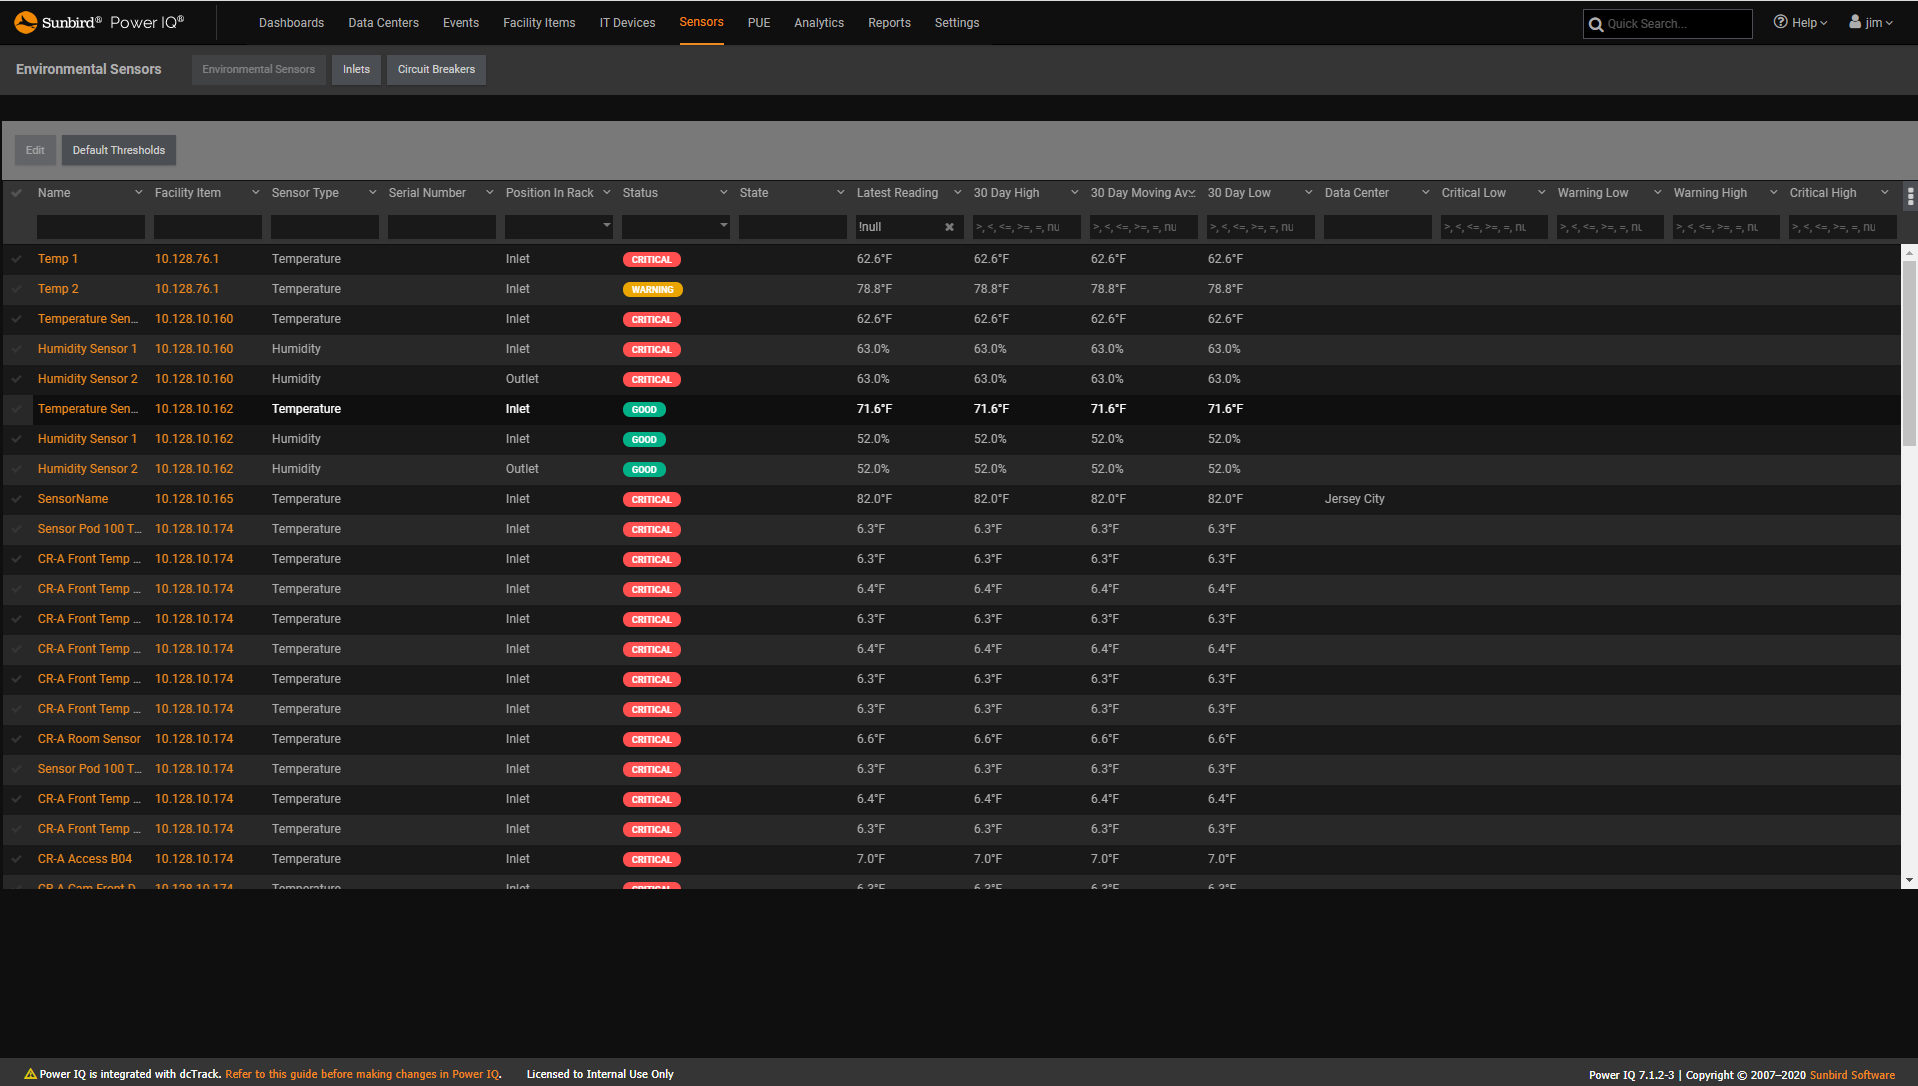
    Monitor thresholds and report on all your environmental sensors

    Power IQ DCIM Monitoring | Environment Management
    Environmental Sensor Threshold Monitoring and Reporting
  • Screenshot of Power Sensor Threshold Monitoring and Reporting
    Screenshot of Power Sensor Threshold Monitoring and Reporting
    Power Sensor Threshold Monitoring and Reporting

    Monitor thresholds and report on all your power sensors

    Power IQ DCIM Monitoring | Power Management
    Power Sensor Threshold Monitoring and Reporting
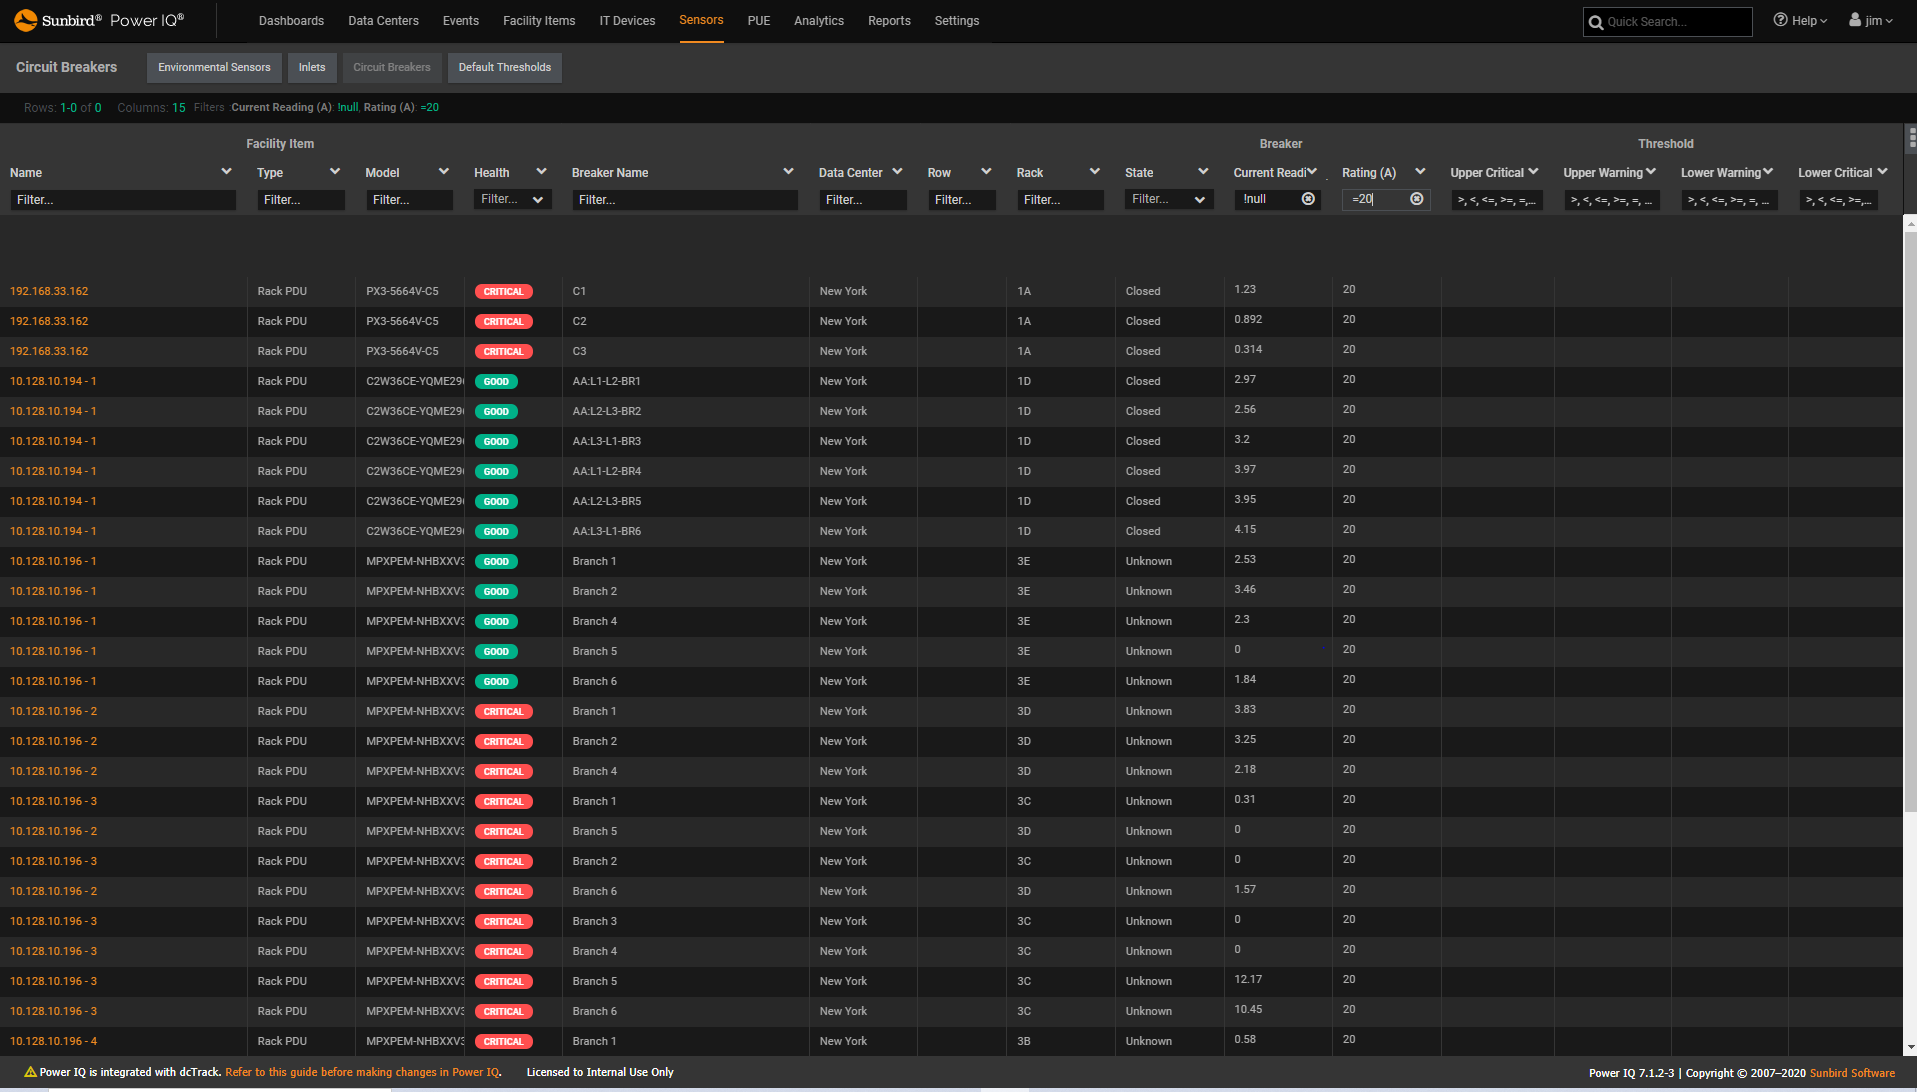
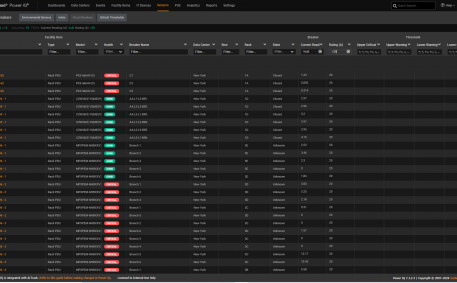
  • Screenshot of Rack PDU Circuit Breaker Threshold Monitoring and Reporting
    Screenshot of Rack PDU Circuit Breaker Threshold Monitoring and Reporting
    Rack PDU Circuit Breaker Threshold Monitoring and Reporting

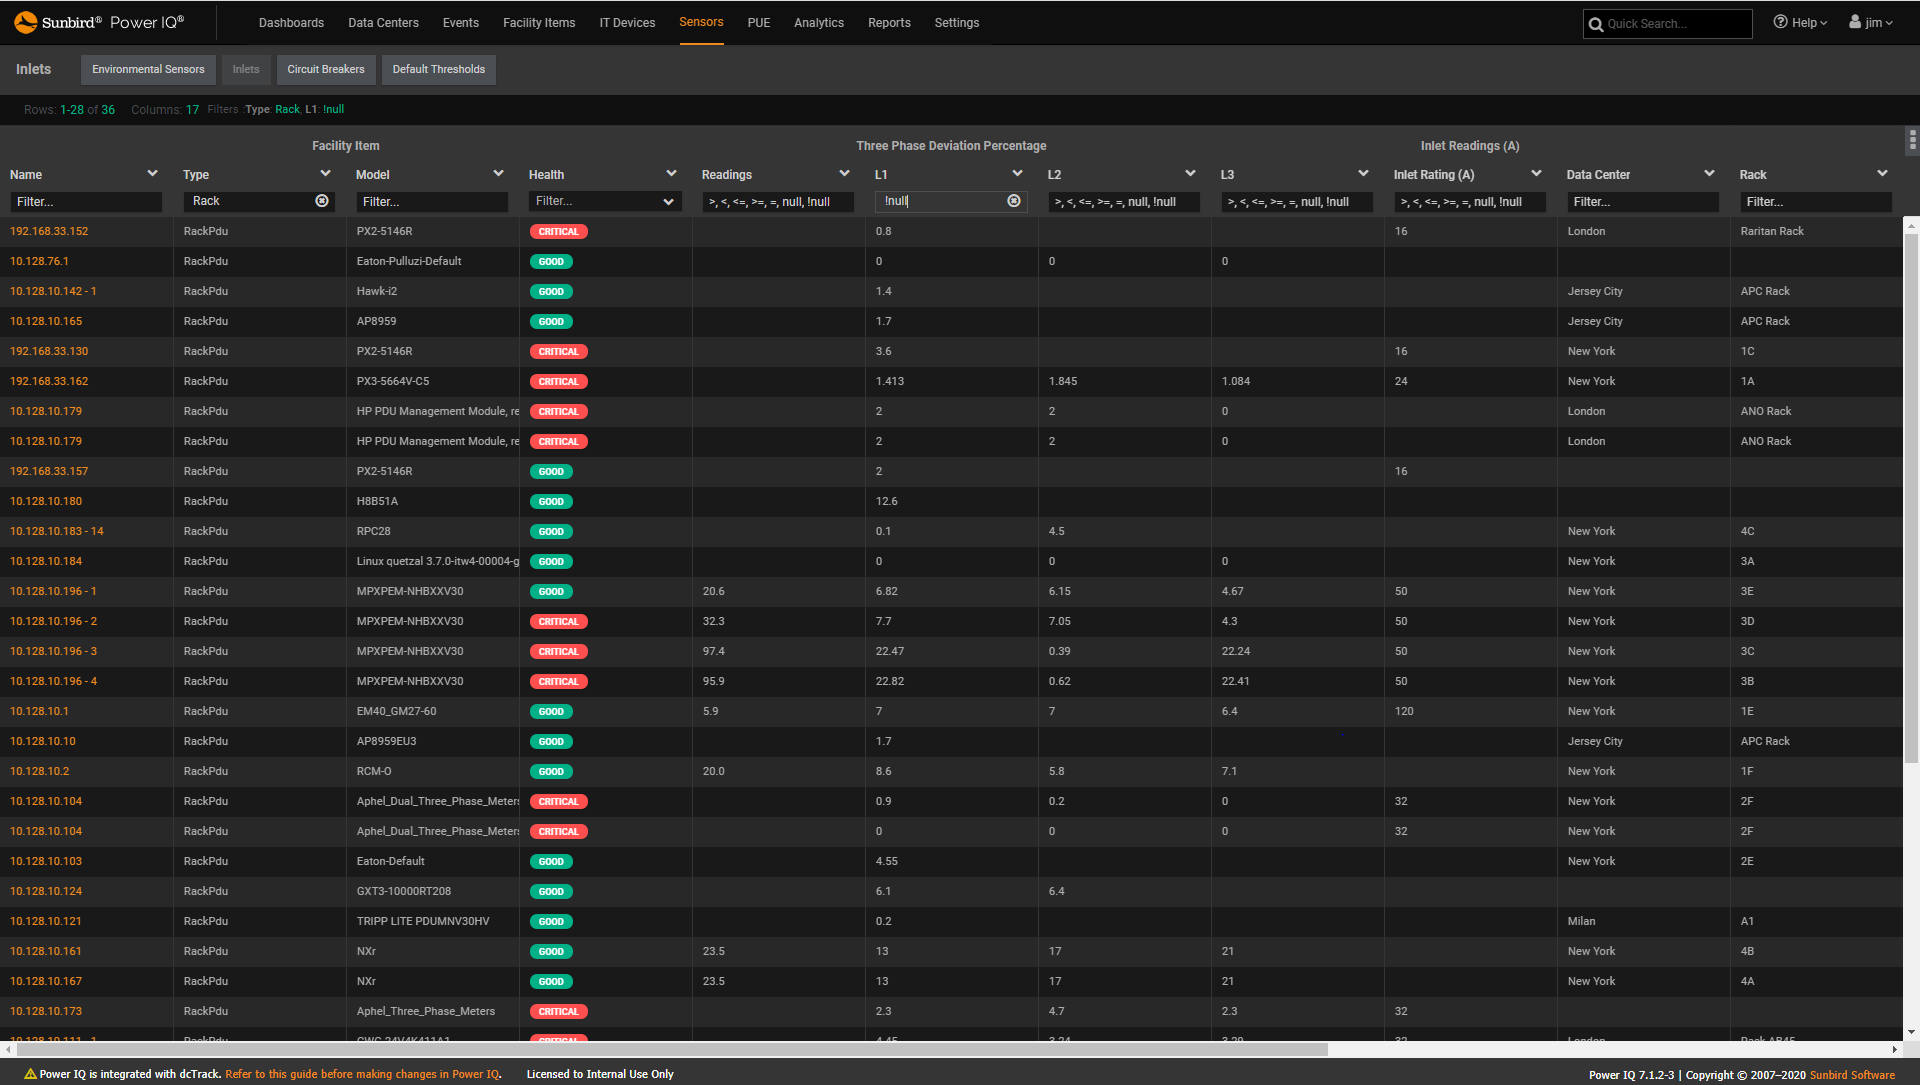
    Monitor thresholds and report on all your rack PDU circuit breakers

    Power IQ DCIM Monitoring | Power Management
    Rack PDU Circuit Breaker Threshold Monitoring and Reporting
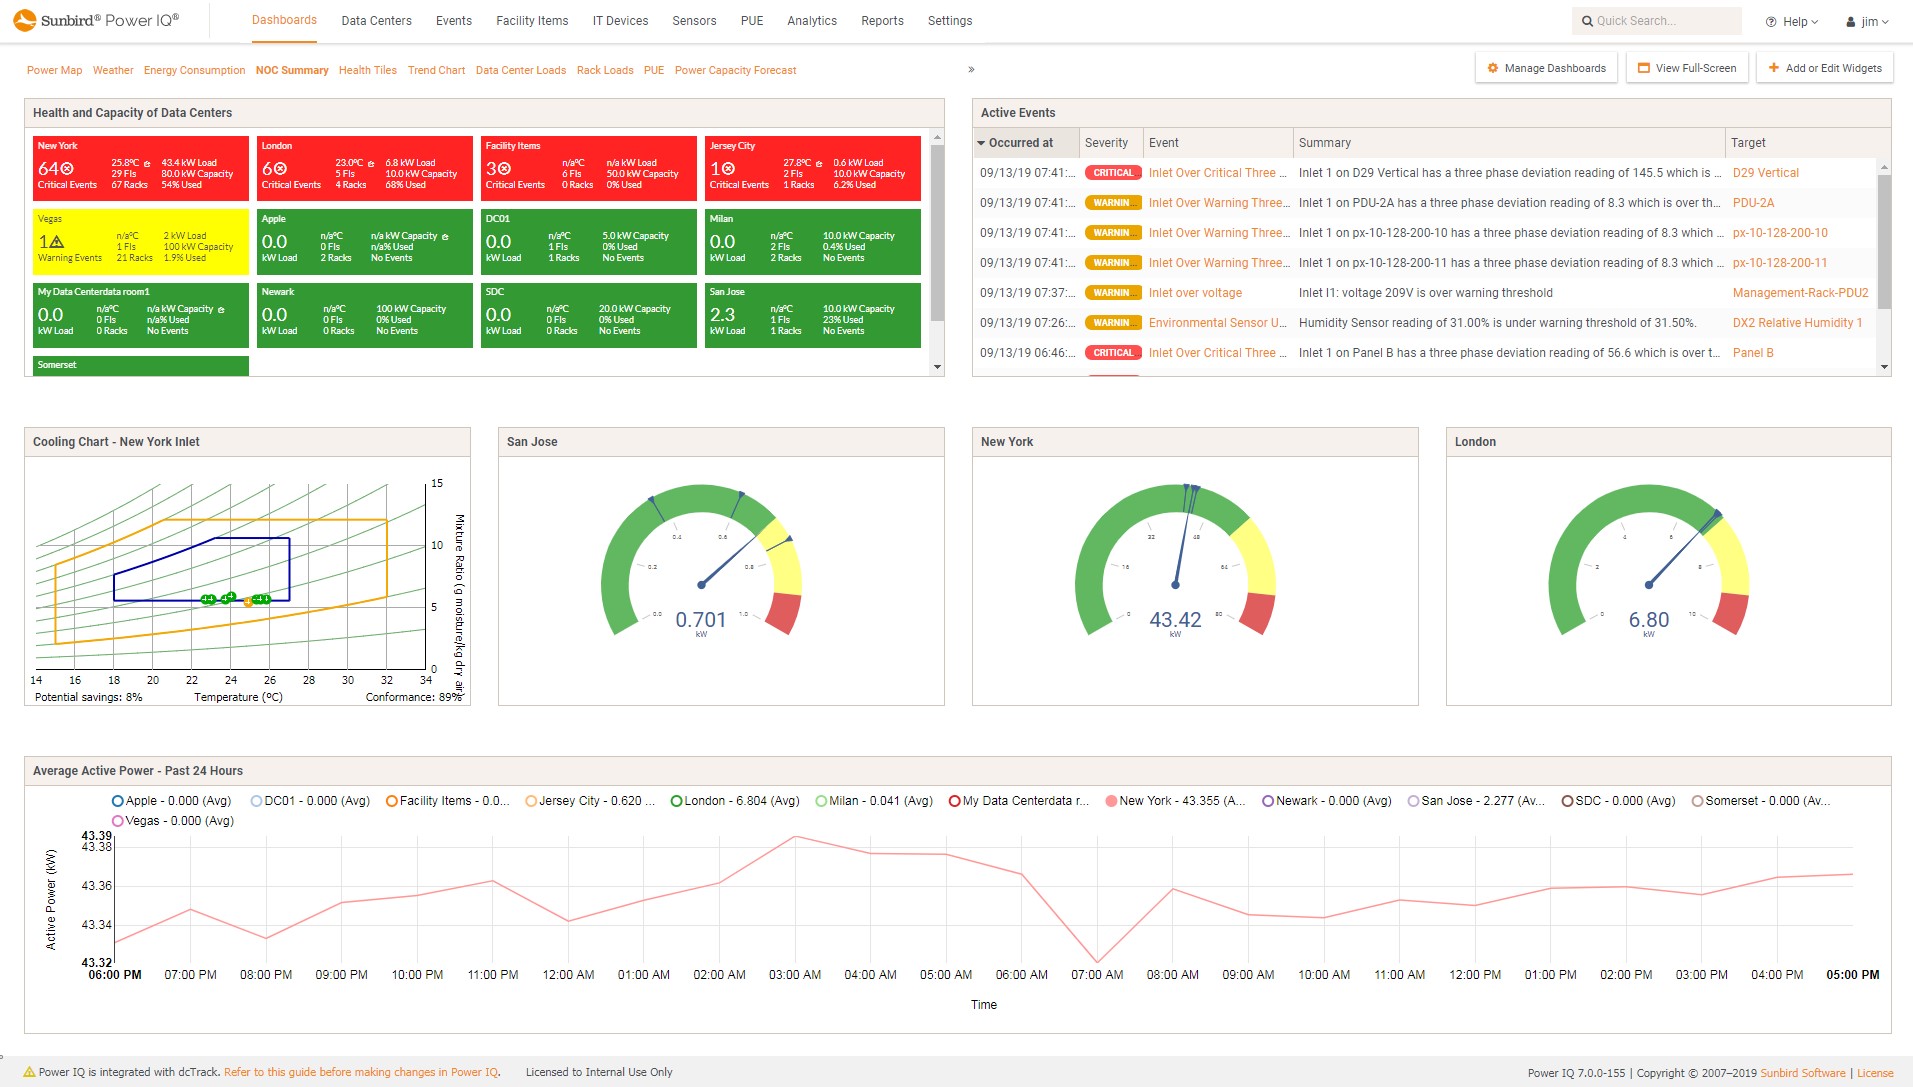
  • Screenshot of NOC Dashboard
    Screenshot of NOC Dashboard
    NOC Dashboard

    Network Operations Center to ensure the health of your data center

    Power IQ DCIM Monitoring | Power Management | Environment Management | BI & Data Analytics
    NOC Dashboard
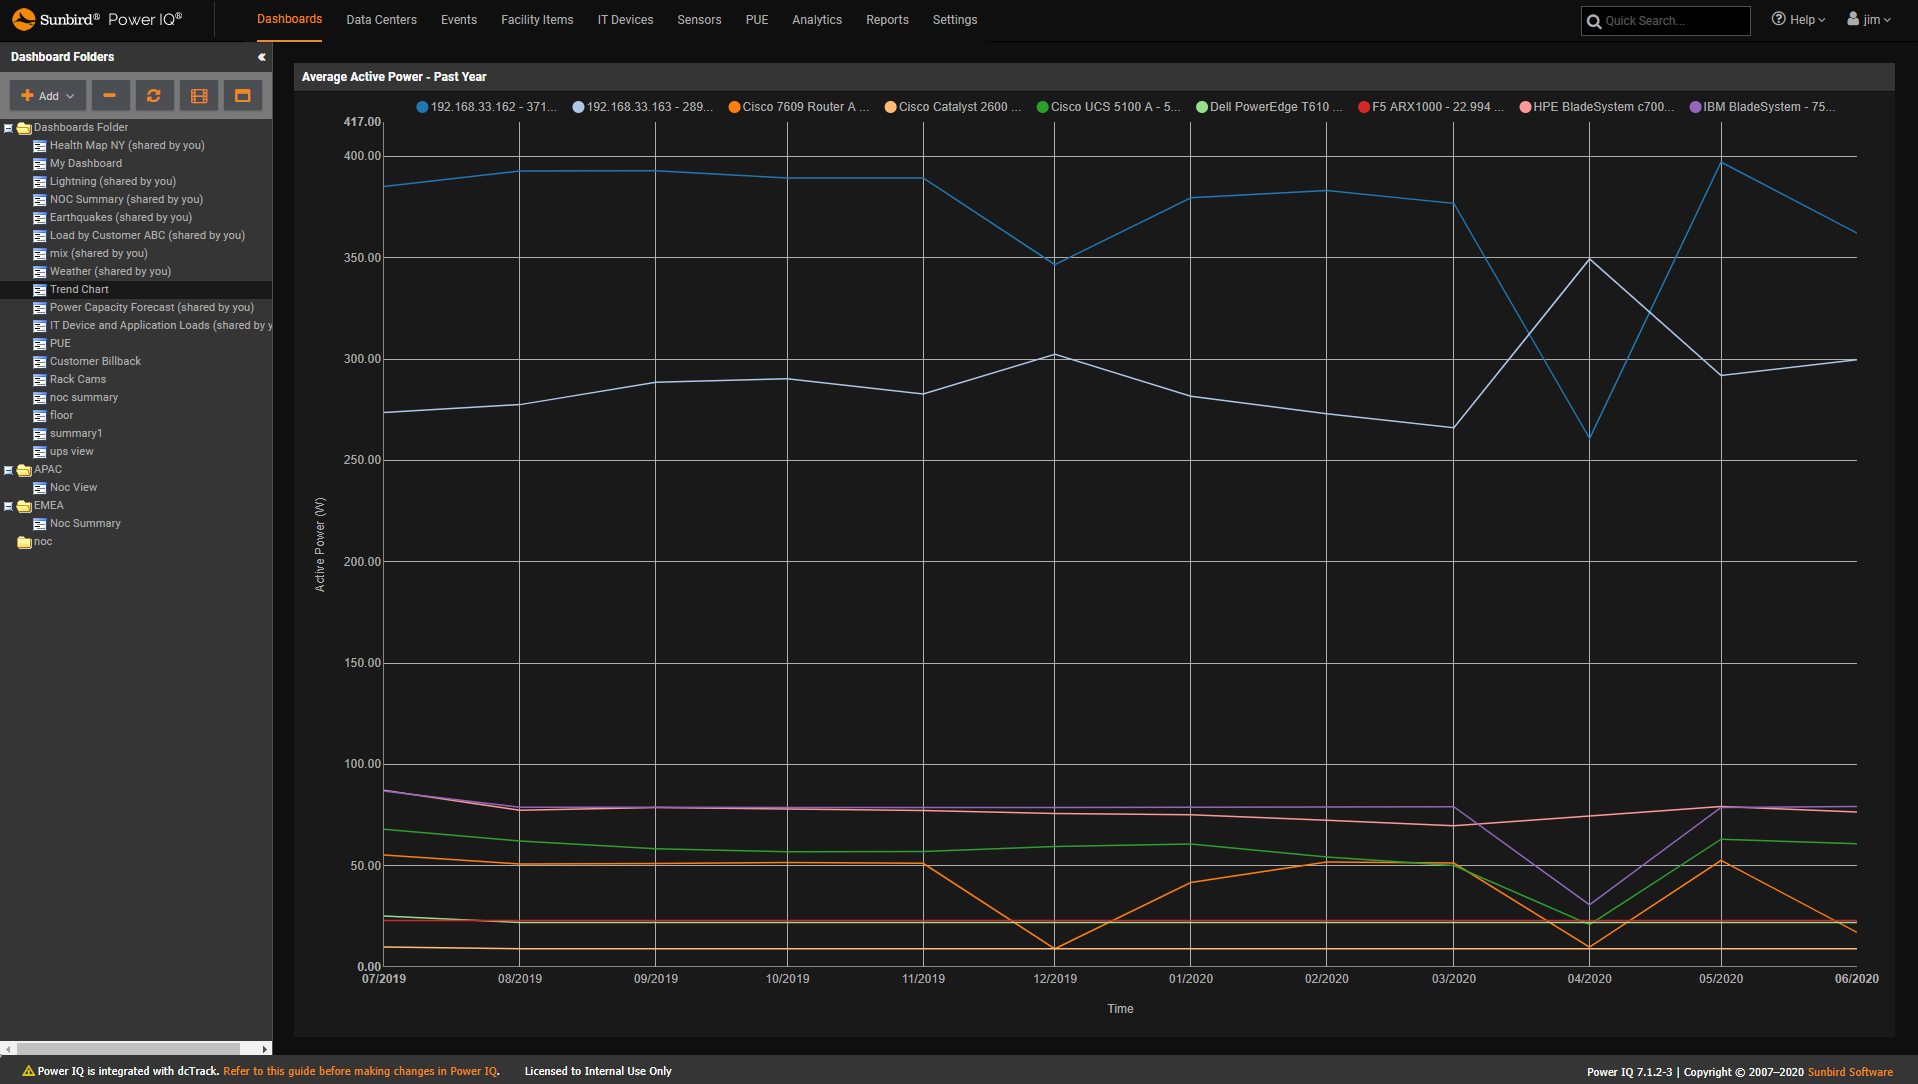
  • Screenshot of Trend Measured Readings
    Screenshot of Trend Measured Readings
    Trend Measured Readings

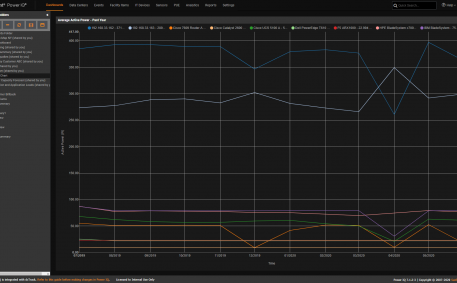
    Trend measured readings over time, as in this example of Average Active Power - Past Year

    Power IQ DCIM Monitoring | Power Management | BI & Data Analytics
    Trend Measured Readings
  • Screenshot of Security Camera Video
    Screenshot of Security Camera Video
    Security Camera Video

    View all your webcams from our dashboard.

    Power IQ DCIM Monitoring | Dashboards
    Security Camera Video
  • Screenshot of Rack Temperature Report
    Screenshot of Rack Temperature Report
    Rack Temperature Report

    Improve uptime by resolving hot spots before they cause an incident.

    Power IQ DCIM Monitoring | Environment Management
    Rack Temperature Report
  • Screenshot of Rack PDU Bulk Configuration
    Screenshot of Rack PDU Bulk Configuration
    Rack PDU Bulk Configuration

    Easily manage your intelligent rack PDU configuration.

    Power IQ DCIM Monitoring | Power Management
    Rack PDU Bulk Configuration
  • Screenshot of Multi Vendor Data Collection
    Screenshot of Multi Vendor Data Collection
    Multi Vendor Data Collection

    Monitor and collect data from any manufacturer.

    Power IQ DCIM Monitoring | Power Management
    Multi Vendor Data Collection
  • Screenshot of Manage Severity Levels
    Screenshot of Manage Severity Levels
    Manage Severity Levels

    Always see the incidents your care most about by having control to tune our severity levels to your strands.

    Power IQ DCIM Monitoring | Power Management
    Manage Severity Levels
  • Screenshot of Live Weather Maps
    Screenshot of Live Weather Maps
    Live Weather Maps

    Improve uptime and capacity utilization by tracking the current status with easy to understand green, yellow and red tiles with the ability to drill down to see the details.

    Power IQ DCIM Monitoring | Dashboards
    Live Weather Maps
  • Screenshot of Health and Capacity Tiles
    Screenshot of Health and Capacity Tiles
    Health and Capacity Tiles

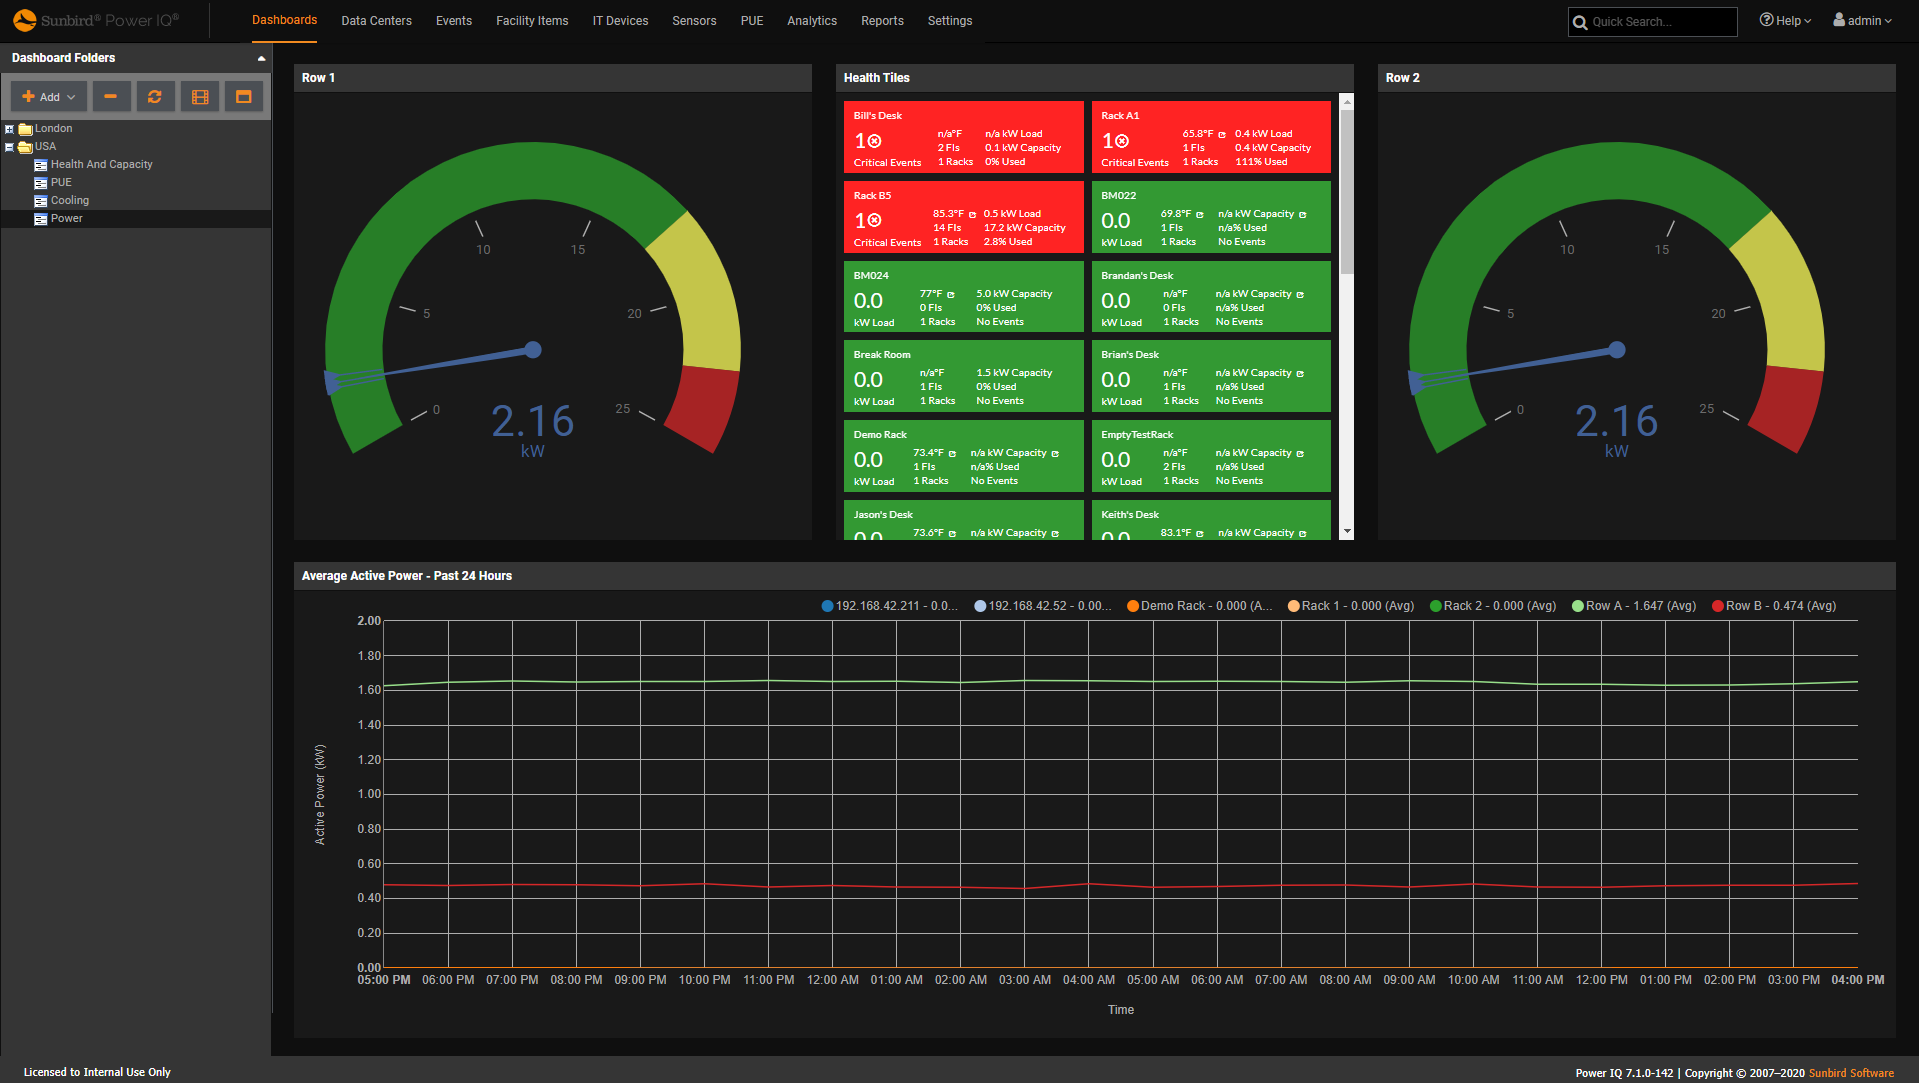
    Improve uptime and capacity utilization by tracking the current status with easy to understand green, yellow and red tiles with the ability to drill down to see the details.

    Power IQ DCIM Monitoring | Power Management | Capacity Management
    Health and Capacity Tiles
  • Screenshot of Customer Energy Consumption
    Screenshot of Customer Energy Consumption
    Customer Energy Consumption

    Improve your capacity forecasts by tracking energy consumption trends by customer.

    Power IQ DCIM Monitoring | Energy Management
    Customer Energy Consumption
  • Screenshot of Compute Device Trend Chart
    Screenshot of Compute Device Trend Chart
    Compute Device Trend Chart

    Increase the utilization of your existing resources by understanding the load of your compute devices in your environment and use this information to eliminate stranded power capacity.

    Power IQ DCIM Monitoring | Power Management
    Compute Device Trend Chart
  • Screenshot of Application Load Report
    Screenshot of Application Load Report
    Application Load Report

    Track loads from an device power supply, by application, by customer or virtually any other level.

    Power IQ DCIM Monitoring | Power Management
    Application Load Report
  • Screenshot of Customer Billing Report
    Screenshot of Customer Billing Report
    Customer Billing Report

    Drive energy efficient behavior by reporting energy consumption reports with full details to all customers.

    Power IQ DCIM Monitoring | Power Management
    Customer Billing Report
  • Screenshot of Configurable Health and Data Polling
    Screenshot of Configurable Health and Data Polling
    Configurable Health and Data Polling

    Enterprise class polling engine that monitors the status and collects data about your power across all your locations.

    Power IQ DCIM Monitoring | Power Management
    Configurable Health and Data Polling
  • Screenshot of Circuit Breaker Status Report
    Screenshot of Circuit Breaker Status Report
    Circuit Breaker Status Report

    Improve your time to restore a rack PDU to service by being the first person to know when a circuit breaker has tripped.

    Power IQ DCIM Monitoring | Power Management
    Circuit Breaker Status Report
  • Screenshot of Cabinet Capacity and Redundancy Report
    Screenshot of Cabinet Capacity and Redundancy Report
    Cabinet Capacity and Redundancy Report

    Improve uptime by creating a daily report to highlight racks that are low on capacity and dangerously close to being outside of your redundancy requirements.

    Power IQ DCIM Monitoring | Power Management | Capacity Management
    Cabinet Capacity and Redundancy Report
  • Screenshot of 3 Phase Power Balancing Report
    Screenshot of 3 Phase Power Balancing Report
    3 Phase Power Balancing Report

    Make your power change more efficient and extend its useful life.  Easily report your three-phase power load and receive alerts when you are out of balance.

    Power IQ DCIM Monitoring | Power Management
    3 Phase Power Balancing Report
  • Screenshot of Health and Capacity Widgets
    Screenshot of Health and Capacity Widgets
    Health and Capacity Widgets

    This sample dashboard shows the health and capacity of racks and locations.

    Power IQ DCIM Monitoring | Capacity Management | Dashboards
    Health and Capacity Widgets
  • Screenshot of Sensor List
    Screenshot of Sensor List
    Sensor List

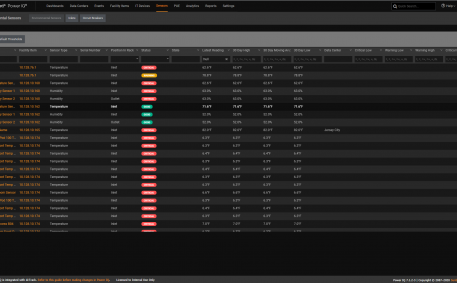
    The Sensors tab displays a grid that lists the sensors in Power IQ and provides information about them, including name, associated facility item, type, and thresholds. In this tab, you can easily view and manage all sensors in Power IQ.

    Power IQ DCIM Monitoring | Power Management | Environment Management | Energy Management
    Sensor List
  • Screenshot of Data Center Energy and Loads
    Screenshot of Data Center Energy and Loads
    Data Center Energy and Loads

    This report displays the energy in kWh for multiple data center locations.

    Power IQ DCIM Monitoring | Energy Management | BI & Data Analytics
    Data Center Energy and Loads
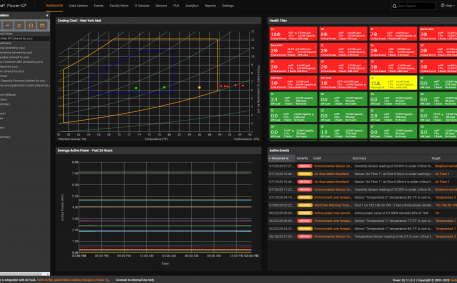
  • Screenshot of Projected Days of Power Capacity Remaining
    Screenshot of Projected Days of Power Capacity Remaining
    Projected Days of Power Capacity Remaining

    The Capacity Forecast Chart helps you identify your current power consumption trends and forecast when you will run out of power.

    Power IQ DCIM Monitoring | Power Management | Capacity Management | BI & Data Analytics
    Projected Days of Power Capacity Remaining
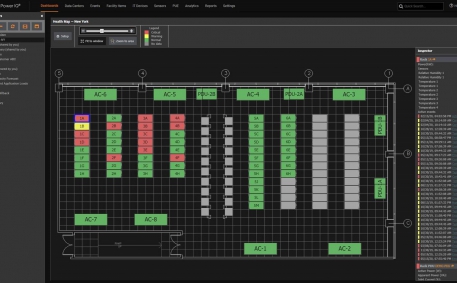
  • Screenshot of Health and Capacity Floor Map with Cabinet Inspector
    Screenshot of Health and Capacity Floor Map with Cabinet Inspector
    Health and Capacity Floor Map with Cabinet Inspector

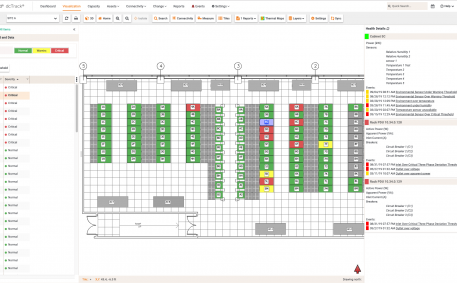
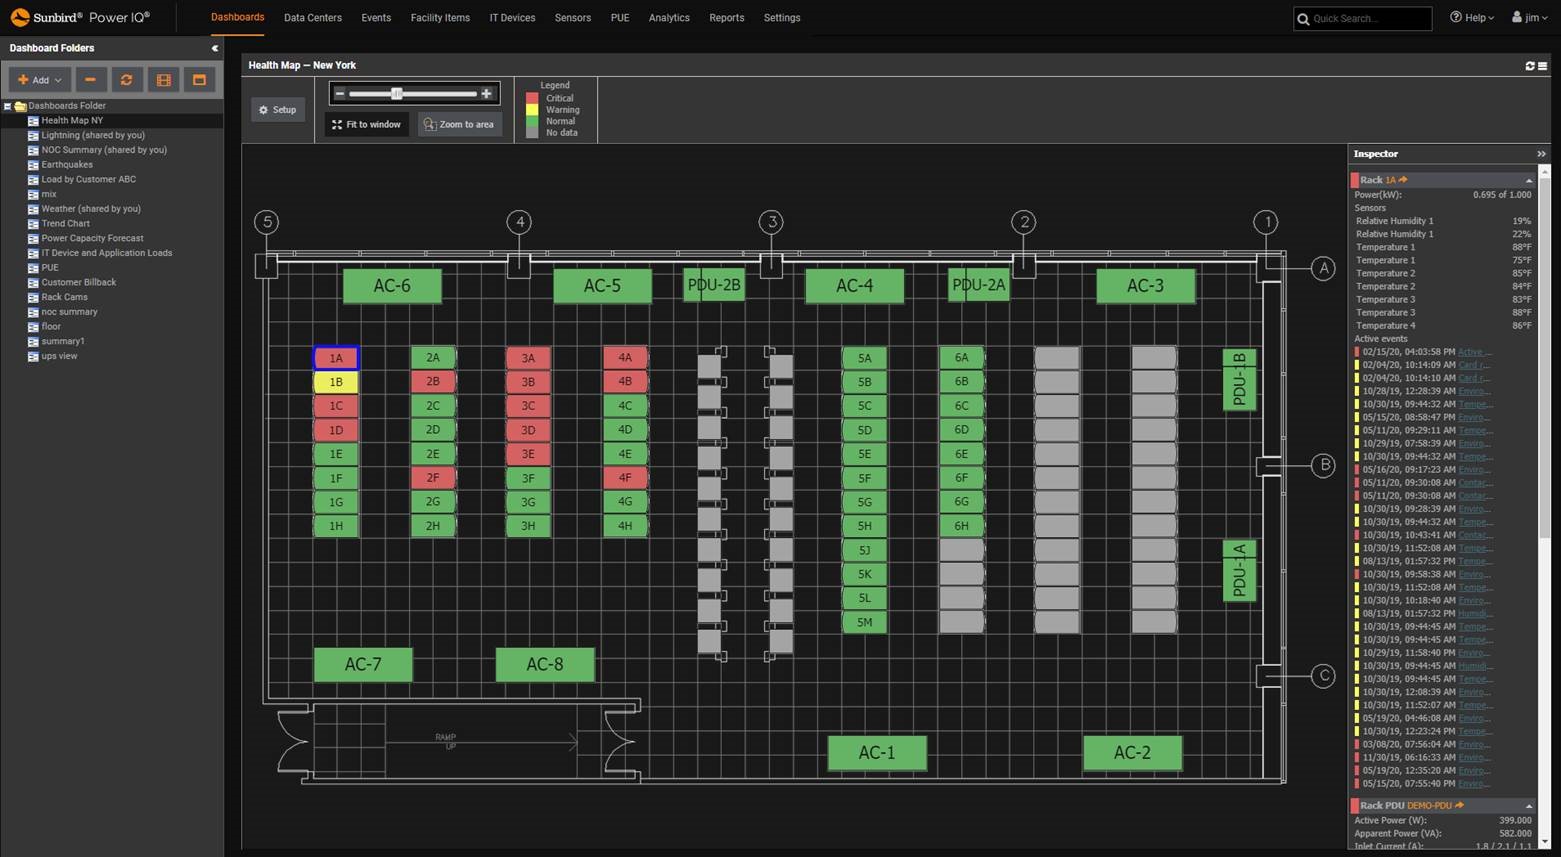
    The real-time, color-coded data center health map dashboard provides an at-a-glance view of health conditions in your data center.

    Power IQ DCIM Monitoring | Power Management | Environment Management | BI & Data Analytics | Visualization
    Health and Capacity Floor Map with Cabinet Inspector
  • Screenshot of IT Device Groups Power Control
    Screenshot of IT Device Groups Power Control
    IT Device Groups Power Control

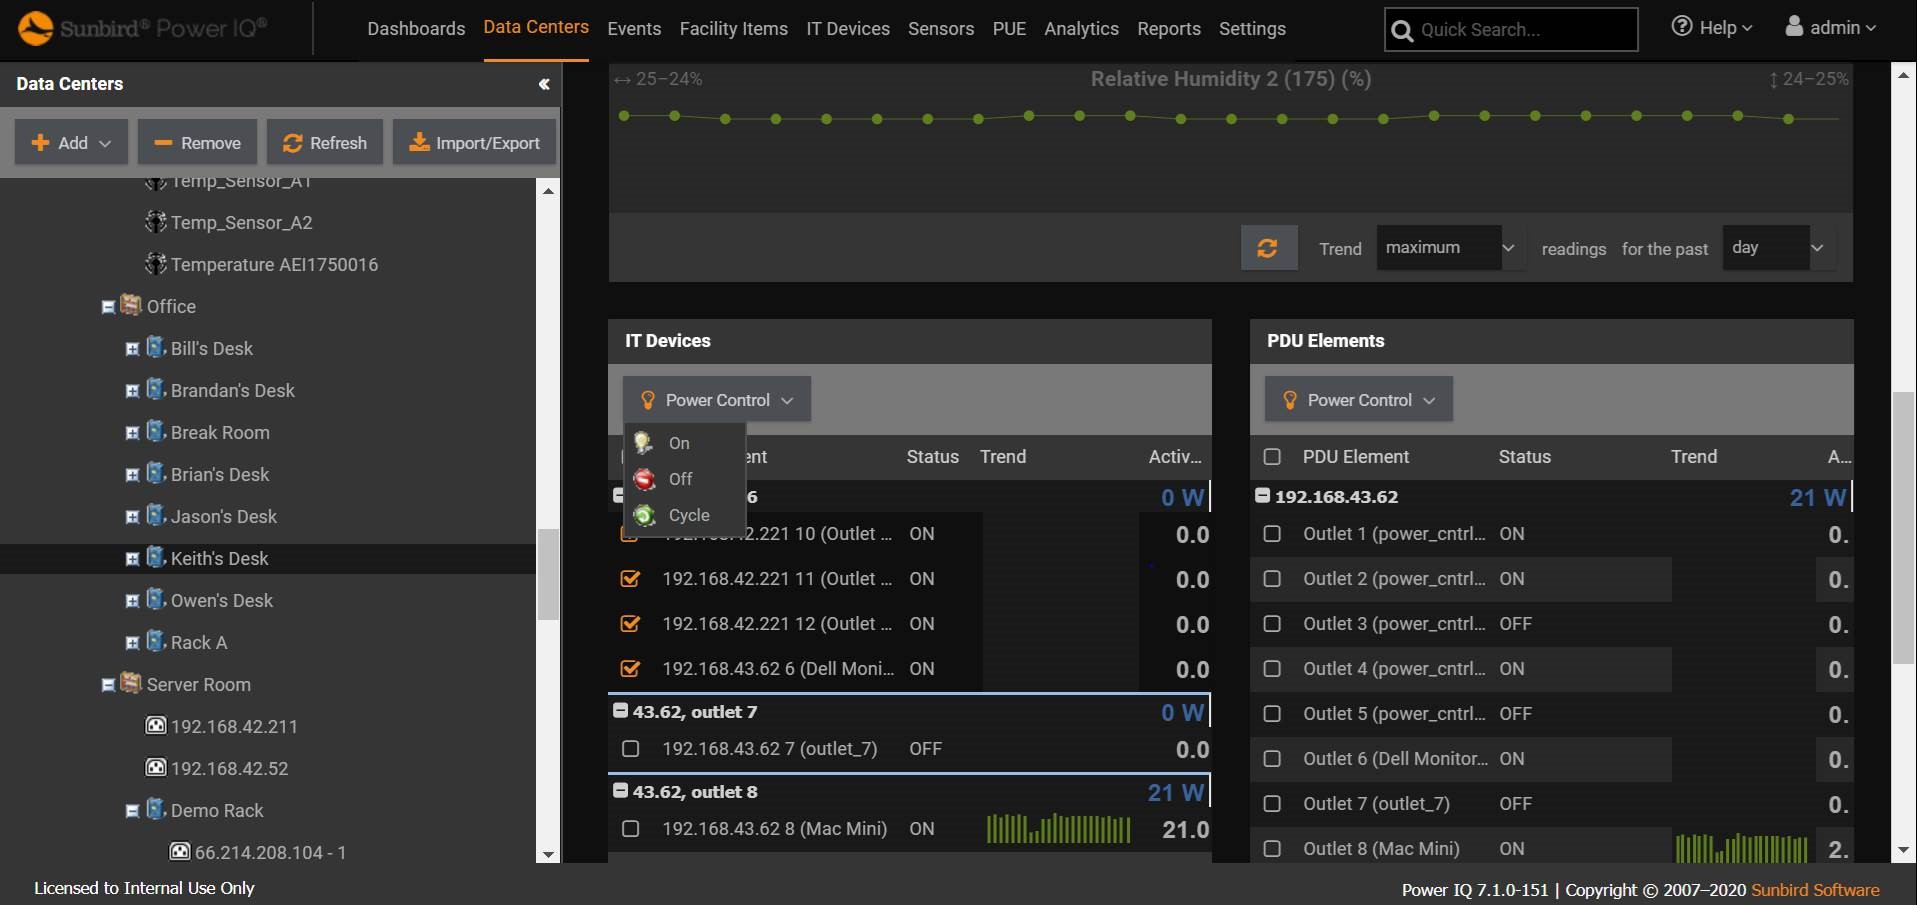
    The IT Device List displays all IT devices supported by Power IQ, including servers and rack transfer switches.

    Power IQ DCIM Monitoring | Asset Management
    IT Device Groups Power Control
  • Screenshot of Facility Items List
    Screenshot of Facility Items List
    Facility Items List

    The Facility Items List displays all items that Power IQ polls to gather power or sensor data. These include rack PDUs, CRACs, floor PDUs, floor UPSs, power panels, standalone meters, and environmental sensor aggregators.

    Power IQ DCIM Monitoring | Asset Management
    Facility Items List
  • Screenshot of Alarm List
    Screenshot of Alarm List
    Alarm List

    The Events Listing displays a list of warning, critical, and informational event notifications that are generated when certain conditions in your data center are met.

    Power IQ DCIM Monitoring | Power Management | Environment Management
    Alarm List
  • Screenshot of Door Status and Electronic Lock Control
    Screenshot of Door Status and Electronic Lock Control
    Door Status and Electronic Lock Control

    See critical information about a door, including its mapped sensors, permissions, and auto-relock timer settings. Authorized users can lock and unlock doors on this page.

    Power IQ DCIM Monitoring | Security
    Door Status and Electronic Lock Control
  • Screenshot of Electronic Door Status Report
    Screenshot of Electronic Door Status Report
    Electronic Door Status Report

    The Electronic Door Status Report provides security status information for a door at the current date and time.

    Power IQ DCIM Monitoring | Security
    Electronic Door Status Report
  • Screenshot of Electronic Door Audit Report
    Screenshot of Electronic Door Audit Report
    Electronic Door Audit Report

    The Electronic Door Audit Report provides door, door handle, and card reader access summaries for doors for a specific location and date range.

    Power IQ DCIM Monitoring | Security | BI & Data Analytics
    Electronic Door Audit Report
  • Screenshot of Tree Navigation with Role Based Access
    Screenshot of Tree Navigation with Role Based Access
    Tree Navigation with Role Based Access

    Tree navigation shows hierarchical relationships among objects in your data centers, rooms, racks, and other locations, with one-click access to detailed information about each object. 

    Power IQ DCIM Monitoring | Power Management | Security
    Tree Navigation with Role Based Access
  • Screenshot of Smart Card Access
    Screenshot of Smart Card Access
    Smart Card Access

    Power IQ supports card reader access control via RFID card readers. Within the software, you can view and update information about a card reader in the system, including serial number and manufacturer, associated doors, and permissions. 

    Power IQ DCIM Monitoring | Security
    Smart Card Access
  • Screenshot of Ghost Server Report
    Screenshot of Ghost Server Report
    Ghost Server Report

    Get the most out of your current data center power, cooling, and space with a report that identifies servers that are candidates for consolidation. This daily report is sent right to your email inbox.

    Power IQ DCIM Monitoring | Power Management | Environment Management | Capacity Management
    Ghost Server Report
  • Screenshot of Carbon Foot Print by Location
    Screenshot of Carbon Foot Print by Location
    Carbon Foot Print by Location

    Meet your compliance requirements by reducing your data center carbon footprint.  Know your current carbon emissions by location, set a target and track your performance over time.

    Power IQ DCIM Monitoring | Environment Management
    Carbon Foot Print by Location
  • Screenshot of Power Capacity by Location
    Screenshot of Power Capacity by Location
    Power Capacity by Location

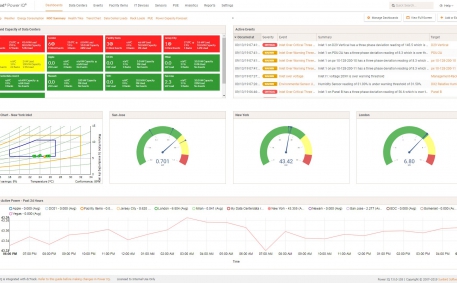
    This sample dashboard shows the maximum active power over the past year for multiple locations as well as capacity gauges for major locations.

    Power IQ DCIM Monitoring | Power Management | Capacity Management
    Power Capacity by Location
  • Screenshot of Remote Power Control of Multi Power Supply Device
    Screenshot of Remote Power Control of Multi Power Supply Device
    Remote Power Control of Multi Power Supply Device

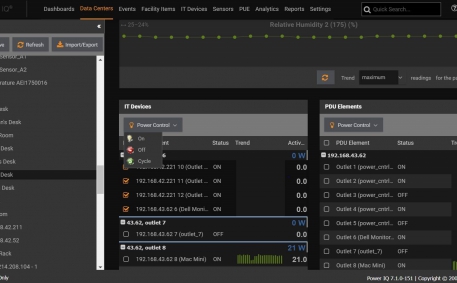
    Remote power control of multi power supply device from within the Power IQ software.

    Power IQ DCIM Monitoring | Power Management
    Remote Power Control of Multi Power Supply Device
  • Screenshot of Power Monitoring Dashboard
    Screenshot of Power Monitoring Dashboard
    Power Monitoring Dashboard

    This sample Power Monitoring dashboard shows just a few of the metrics that can be tracked.

    Power IQ DCIM Monitoring | Power Management | BI & Data Analytics
    Power Monitoring Dashboard
  • Screenshot of ASHRAE Cooling Charts
    Screenshot of ASHRAE Cooling Charts
    ASHRAE Cooling Charts
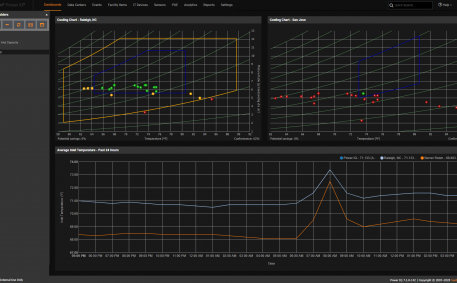
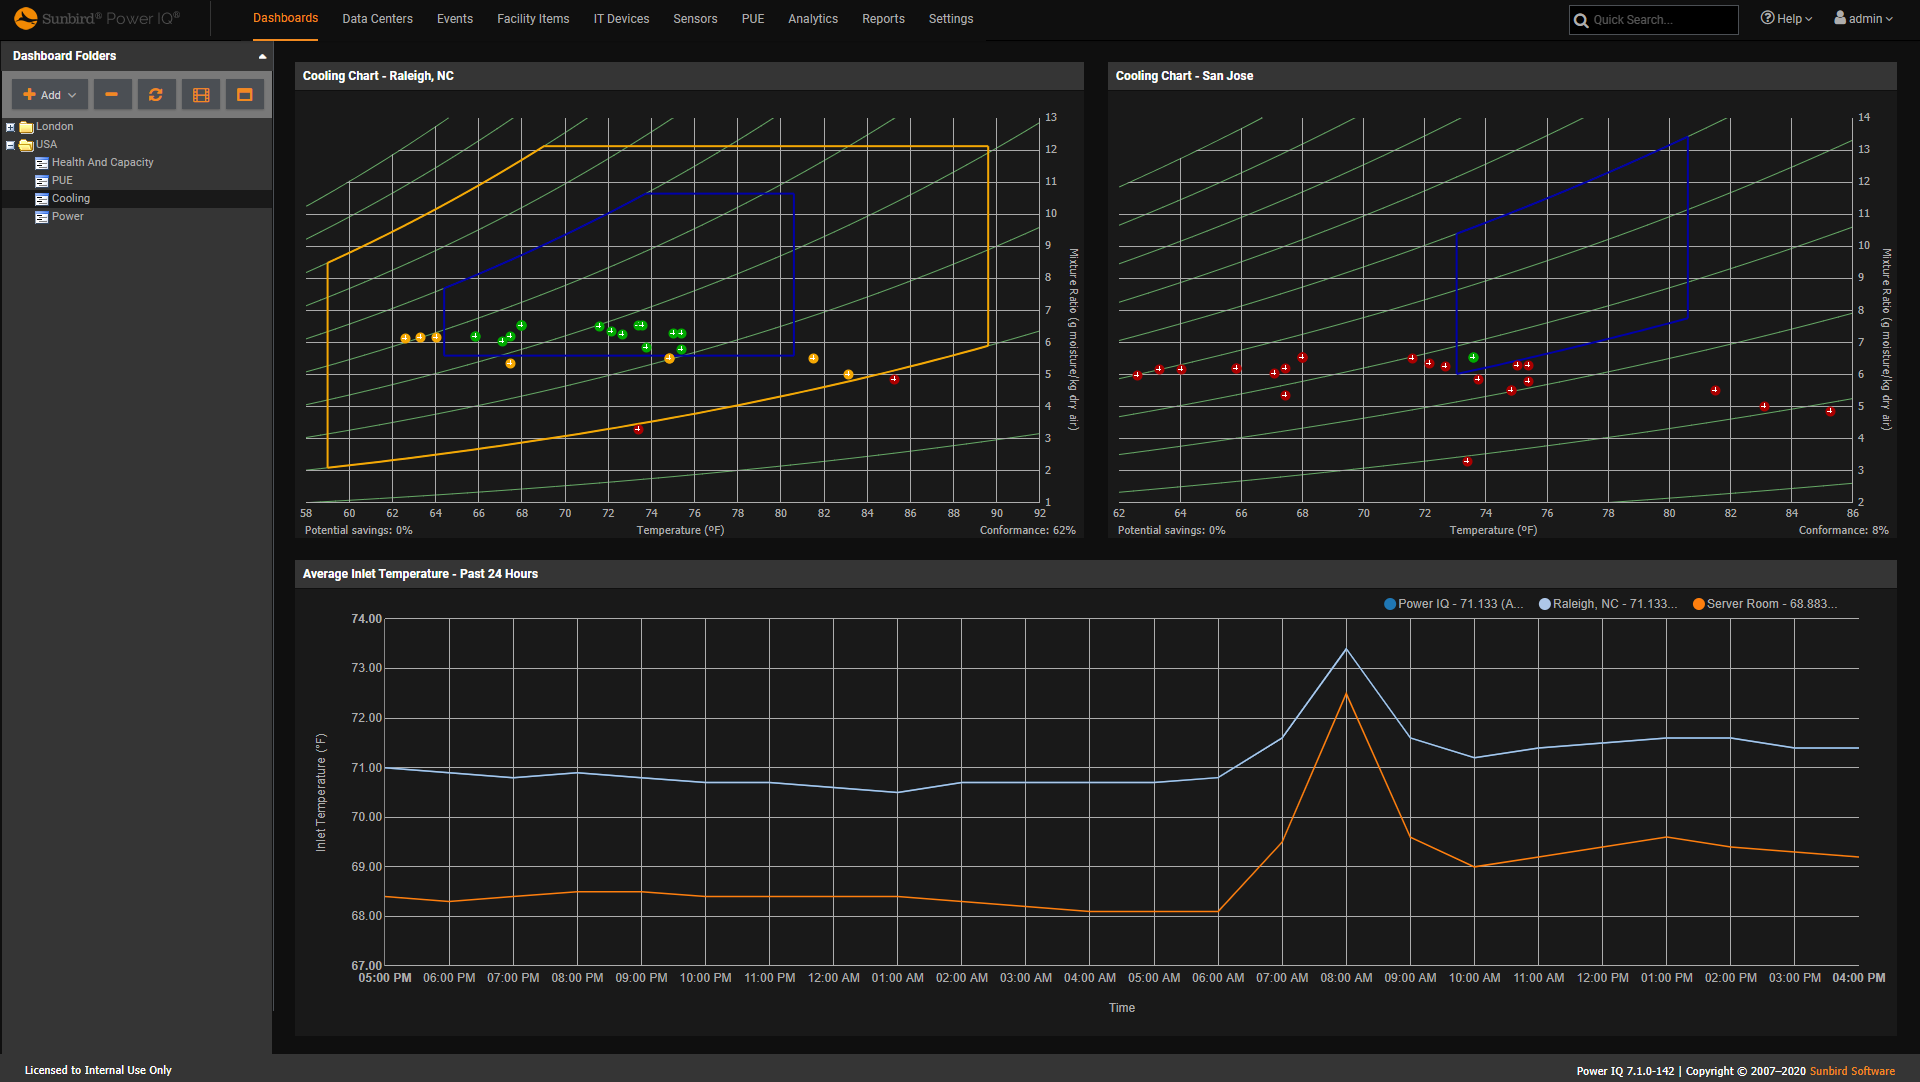
    Avoid hotspots and overcooling with patented electronic psychrometric cooling charts help you keep cabinets in the ASHRAE®- or manufacturer-recommended environmental ranges for potential cost savings and to extend the life of your equipment.
    Power IQ DCIM Monitoring | Environment Management | BI & Data Analytics
    ASHRAE Cooling Charts
  • Screenshot of PUE Gauge and Trends
    Screenshot of PUE Gauge and Trends
    PUE Gauge and Trends
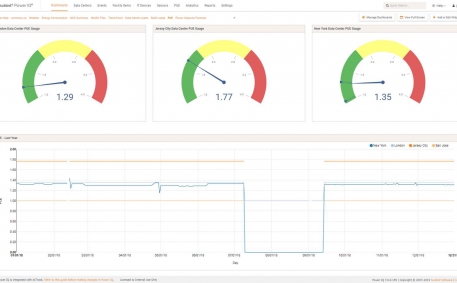
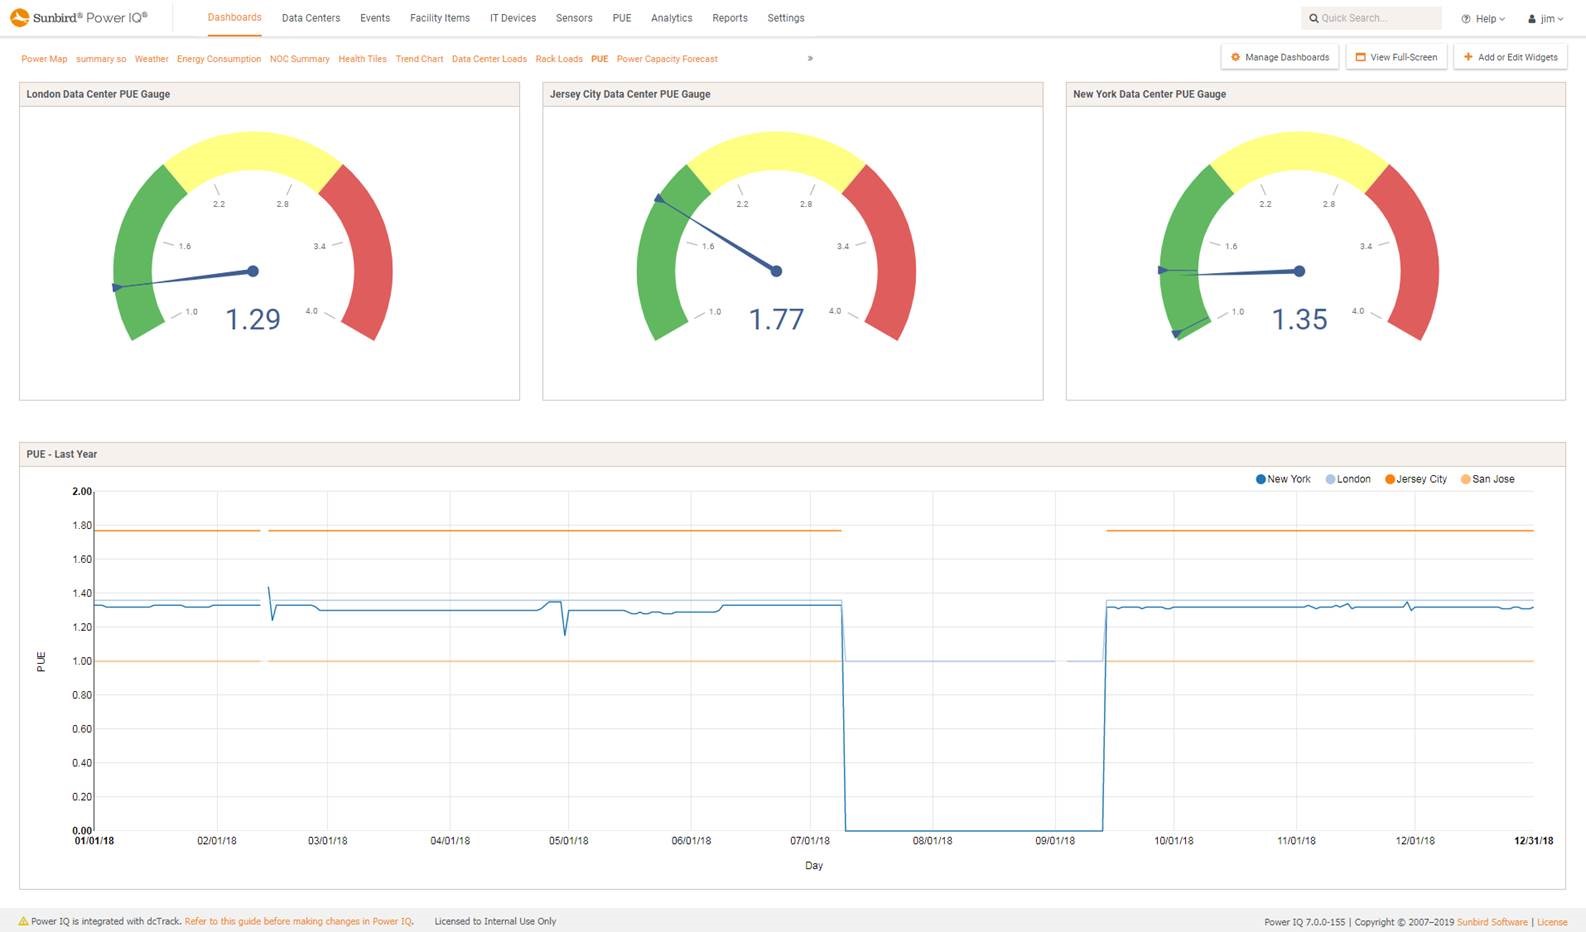
    This sample PUE Dashboard shows two widgets for measuring power usage effectiveness: a PUE gauge and a PUE line chart.
    Power IQ DCIM Monitoring | Power Management | Energy Management
    PUE Gauge and Trends