Power & Network
We've got both covered
- Automatically validate physical connections and media type
- Visually track cable plant to simplify troubleshooting and maintenance
- Select any cable connection and get a complete view of the circuit from origin to termination
- Create connections automatically with just the start and end points
- Easily budget power at every connection point in the power chain from the UPS to the device power supply with (N) or (N+1) redundancy to reduce downtime
- Calculations are done instantly, which eliminates manual effort and human error
- View both a tabular and a visual circuit trace so you can quickly spot broken connections and reduce troubleshooting time
- Get a holistic view of circuit connections, with hyperlinks to the device/connection attributes to determine fault

Complete Power Distribution Visualization
Visualize, monitor, and budget power usage and capacity from servers to rack PDUs, breakers, panels, and UPSs. Simplify validation, troubleshooting, and maintenance. At each hop, see Item Class, Make, Model, Location, Cabinet, U-Position, RU Height, Connector, Color, Phase, Volts, Max Amps, and Rated Amps.

Visualize All Your Network & Data Circuits
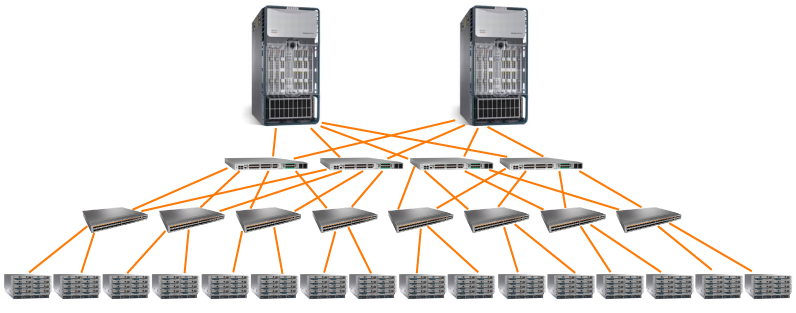
From end to end, document and understand every node in your data circuits to identify single points of failure and decrease troubleshooting time.
- Server with Copper or Fiber Data Connection
- Edge Switching (e.g., Top of Rack/End of Row)
- Core Routing or Switching Equipment
- Patch Panels
- Multiplexing Equipment
- Demarcation Points
- Carrier Wide Area Network
- Even KVM and Serial Console Ports & Connectivity

Connection Guru™ to Help You Make Power and Data Port Connections in Seconds
Sunbird’s patent-pending QuickConnect™ feature makes connections faster and more efficient than ever before. Simply select your starting point and end point, and let QuickConnect automatically give you all the hops in between.
- Connect to items and ports within the same cabinet or identify the far-end item you want to connect to
- Results are more heavily weighted to items that have similar attributes, such as location, media color, phase, volts, VLAN/subnet, protocol, and data rate, depending on the port type
- Only displays compatible ports and connections based on connector and media type
- Filter and hide columns to display only the most relevant results
- Save as many search result views as you want and set your favorite view as your default
- See visual circuit traces before the connection is made
Visualize 3D Cable Connectivity Across Your Entire Data Center
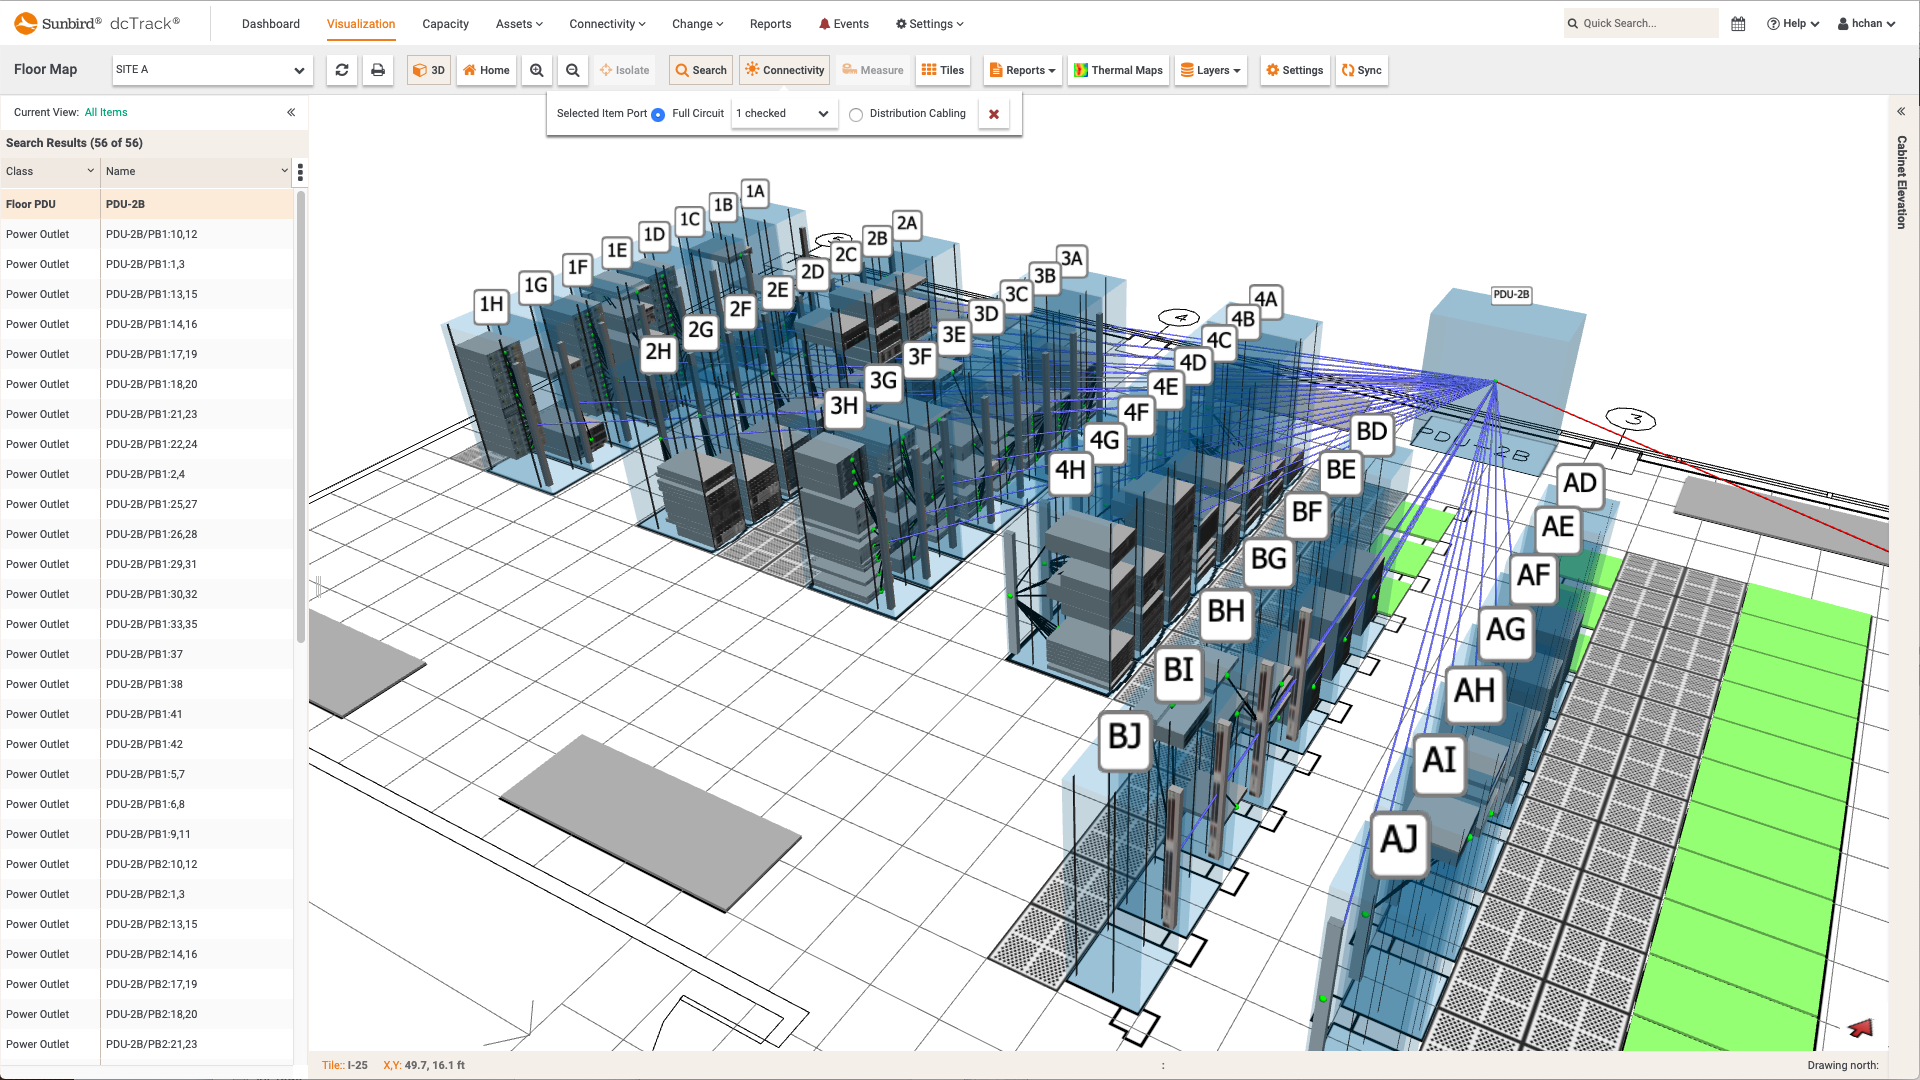
Whether you’re interested in full circuits complete with patch cords or just the structured and power distribution cabling between endpoints, see exactly how items are connected on your data center floor with 3D visualization of all the cabinet hops on your data center floor.
- Easily identify how your assets are connected at the power and data port level
- View full circuits or only the endpoints, including patch cords, structured cabling, and distribution cabling
- Isolate the connected cabinets and zoom in to view the devices inside
- Select patch cord, structured cabling, and distribution cabling colors to match what you use in your data center

Structured Cabling Data
Highways Managed with Ease
In your data center, your structured cables are your highways, and your connections are on/off ramps. With so much structured cabling, it’s easy to let maintenance and infrastructure updates go by the wayside. Make sure you can go from Point A to Point B with ease by managing your structured cabling in bulk.
- Add, edit, and delete structured cabling connections in bulk to easily and accurately document your infrastructure
- Decrease the risk of downtime and unexpected issues when you perform maintenance or updates
- Capture structured cabling attributes, including cable media, length, color, and group
- Determine if your structured cabling can adequately support your network

Measure Twice, Cut Once
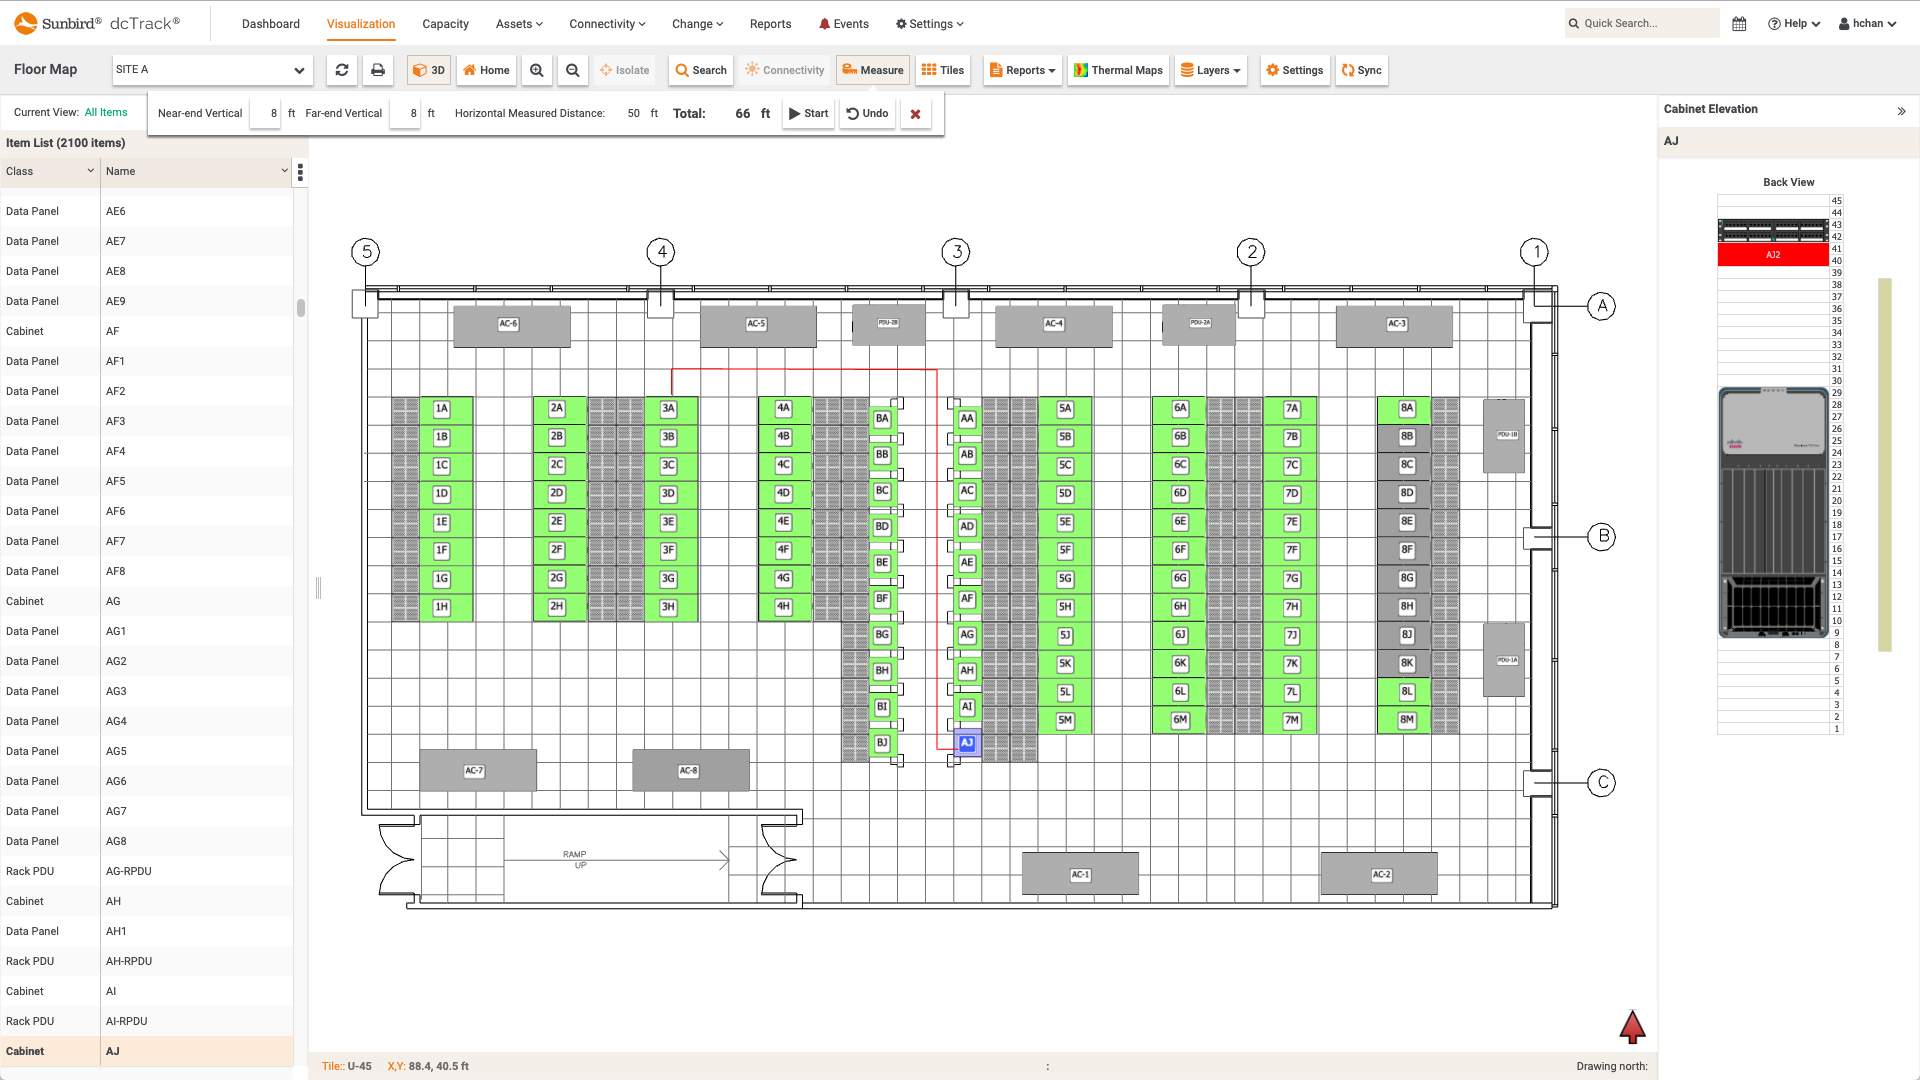
No more walking the data center floor with a tape measure in one hand and a pencil in the other. Measure distances between items you’ll always have just the right length of cabling.
- Capture distances between items automatically: Draw lines to represent cabling on your data center floor with a single click
- Measure more accurately: Eliminate human error resulting from manual calculations and measurements
- Configure the distance from items to the floor: Add near-end and far-end vertical measurements for more precise cord lengths
- View cable tray layers: See cable tray layers for fiber, copper, and other cable types for a full picture of your data center cable management
- Provide measurement data and instructions in work orders to provision new equipment and associated circuits


